Source: https://norradjurgardsstaden2030.se/results
Saved on: 22/11/2026
Sustainability Report 2025
Stockholm Royal Seaport's property developers and the city's projects
About Stockholm Royal Seaport
Stockholm Royal Seaport is one of Europe's largest urban development projects, with clear and ambitious commitment to sustainability. New solutions and innovative ways of working are developed and tested here to contribute to sustainable urban development.
The new district stretches from Husarviken and Hjorthagen in the north to Värtahamnen and Loudden in the south, directly adjacent to the Royal National City Park. The plan comprises at least 12,000 new homes and around 35,000 workplaces, creating a lively and mixed urban environment.
Former industrial land is being transformed into a green, dense and attractive part of Stockholm. Stockholm Royal Seaport offers a diversity of environments and character — from small-scale residential blocks and areas close to nature to large-scale port and energy facilities. History meets the future here, city meets nature, small scale meets large scale.
Development is rooted in the existing qualities of the place. By reinforcing the area's unique identity and drawing inspiration from its history, a district is created with strong character, clear roots and long-term sustainability.
Highlights 2025
- Renovation of the two brick gasholders has continued with a focus on preserving the industrial character. The City is developing a cultural venue that will open in 2027, and CA Fastigheter has plans for a hotel development.
- The consultation for the Hjorthagskransen detailed development plan has been carried out after dialogue meetings held in the square. The formal consultation meeting brought together 80 participants. Gasverksdagen attracted 5,000 visitors featuring guided tours, conversations and dialogue around the physical model, an exhibition on the development, a resident-led flea market and activities for children and adults. 5,000 study visitors, corresponding to 267 groups, have visited the project during the year.
- Calculations for the Saltkajen contract have shown that material substitution and climate-improved concrete saved 2,200 tonnes of CO₂e and SEK 2.1 million. The project received the Swedish Concrete Association's Climate Prize. The climate analysis for Södra Värtan has identified the main drivers of climate impact and proposed measures for continued work. Climate calculations in the design phase have been reported for eleven buildings. The Residential buildings range between 258 and 461 kg CO₂e/m2 GFA, which can be compared with the reference value* of 311 kg CO₂e/m2.
- The application to dump dredged material from Kolkajen has been withdrawn. A new study of alternative development methods for handling bottom sediment has been initiated.
- A symbolic first sod was turned for the final phase of Gasverket as the city together with the property developers each laid a brick.
- The R&D project REV:EU has been granted funding from Formas to develop design documentation and to gather European experience of source-separating wastewater systems.
- During the year, the Mass Consolidation Centre has made it possible to avoid 6,400 truck transports. Since the centre opened, 1,576,000 tonnes of material have been handled, of which 70% have been reused in construction projects. The Construction Consolidation Centre has increased the co-loading rate to 81% and the fill rate for direct transports to 49%.
- Residual waste from households and businesses has decreased by 40% compared with 2014. Pop-up Reuse has welcomed 7,150 visitors and collected 4.8 tonnes of material for reuse.
- In the Brofästet phase, the buildings have achieved an energy performance of 60 kWh/m² Atemp which is 19% better than the requirements in BBR29. Solar energy production in buildings and facilities has amounted to 770 MWh. Most produced more than calculated. Experiences from dialogue meetings with property developers regarding challenges linked to energy performance have been compiled in the report Designing, building and managing energy-efficient buildings.
Reference values for climate impact when constructing buildings, version 3 (2023). Tove Malmqvist (KTH), Sara Borgström (WSP), Johanna Brismark (KTH), Martin Erlandsson (IVL Swedish Environmental Institute). Climate impact for building parts 2–8 and the construction stage (A1–A5), with system boundary according to the 2027 climate declaration.
Reader's guide
Stockholm Royal Seaport's Sustainability Report is produced annually and compiles aggregated results from the follow-up of the sustainability requirements placed on property developers as well as on the City of Stockholm's own works. Follow-up is carried out in accordance with the goals set out in Programme for Sustainable Urban Development, version 3 (2021).
The report begins with an overview map of the area presenting current detailed development plans, followed by a description of the organisation and ways of working. After that, the results from completed phases are reported according to the programme's target areas: living city, accessible and close, resource efficiency and reduced climate impact, let nature do the work, and engagement and learning.
The appendix compiles detailed follow-up data from the city's own work and from the property developers. It also contains historical data, requirements and, in some sections, an overall analysis. Some information comes from the design stage and is therefore preliminary.
In the phases Norra 1, Västra and Värtapiren, the sustainability requirements were voluntary. The results for these parts are based on the property developers' own reporting and have not been verified by the City of Stockholm.
The Sustainability Report targets the project organisation for Stockholm Royal Seaport, the city's officials and politicians, property developers and other stakeholders. Sustainability Reports from previous years can be found under documents, Knowledge & Innovation.
Map
Stockholm Royal Seaport consists of several phases at different stages — completed and ongoing in Hjorthagen, ongoing development in Värtahamnen, and planned in Loudden. The interactive map shows the current status of each phase and detailed development plan, the property developers' results per block, with deep dives into green structure, transport and energy.
Interactive map: phases and property developers
Stages
Organisation and ways of working
Sustainability governance
In 2009 the City of Stockholm adopted the Programme for Sustainable Urban Development, which is the policy document for the sustainability work in Stockholm Royal Seaport. The programme covers five target areas that are continuously revised in step with new knowledge and experience.
The Development Administration coordinates the sustainability work in close collaboration with the city's administrations and companies. The work is carried out in thematic working groups that develop requirements, run development projects and strengthen competence in prioritised areas.
The sustainability requirements are followed up in several stages through a web-based follow-up reporting tool where the property developers' documentation is reviewed and approved by the city's experts. Experience from the follow-up is incorporated into the continued sustainability work. Regular resident surveys provide further valuable input for continued planning. The latest resident survey from 2023 shows a high and increasing satisfaction with living in Stockholm Royal Seaport. Access to green areas, safety and local services are particularly appreciated. At the same time, development needs are identified regarding cultural amenities and indoor social spaces. Mobility patterns suggest an area with a strong cycling culture and relatively low car use, see appendix diagrams 1.1–1.4.
Work environment on the construction site
Stockholm Royal Seaport is growing gradually with more residents and businesses while construction is under way. The City of Stockholm has a zero-tolerance approach to workplace accidents and collaborates with all property developers and contractors to ensure a safe and secure work environment. It is also important that people who are in the vicinity of the construction sites experience safety and security.
Risks are identified and managed as early as the planning stage, with particular focus on construction logistics and the work environment. In parallel, preventive work is carried out to minimise the risk of environmental incidents.
Before construction starts, a mandatory kick-off meeting is held between the Development Administration and the contractor where work environment requirements and safety procedures are reviewed. All personnel must complete a web-based training course in order to be granted access to the construction site. To further strengthen safety, the projects collaborate with the police and the rescue services, and special alarm procedures and response plans have been developed in coordination with SOS Alarm.
A digital reporting tool is used to document observations, incidents and accidents. The high number of reported events reflects a high level of awareness and active work environment efforts, enabling early preventive actions. A small number of workplace accidents have resulted in sick leave, see appendix table 1.1.
The work to prevent environmental incidents is carried out systematically, see appendix table 1.2. The incidents that have nevertheless occurred mainly concern accidental spills of fuel or hydraulic oil.
1. Vibrant city
In Stockholm Royal Seaport, former industrial and harbour areas are being transformed into a dense, safe and cohesive city. The area is being developed with mixed use and housing that meet different needs and stages of life. Well-designed public spaces with multiple functions create the conditions for an active urban life and make the district a natural extension of the inner city. The area offers space for spontaneous encounters between people of different backgrounds and identities. The ambition is an equitable city that everyone can use on equal terms.
Sociotope areas and green oasis
The public realm is planned to be used by many people in different ways. The challenge is to build at high density while still being green, with environments that contribute to recreation, health and quality of life.
Within the area, publicly accessible open spaces with social values, so-called sociotope areas, are being planned, such as parks, squares, quays and natural areas. The goal is for at least 20% of the plan area to consist of sociotope space and for every resident to have access to at least 15 m² of so-called green oasis. So far the sociotope area amounts to 16%, corresponding to 26 m² per home. The green oasis is 11 m² per resident, see appendix, table 1.3.
In Hjorthagen, eleven parks and playgrounds totalling approximately 33,500 m² have been completed. The playgrounds have different themes, for example archipelago, nature and animals. In addition, there are outdoor gyms, a parkour area, a dog park and several sport courts as well as Hjorthagen's sports facility.
Tenure, apartment sizes and functional mix
Stockholm Royal Seaport offers a variety of tenure types and apartment sizes that make it possible to remain in the area through different stages of life. So far 3,160 homes have been completed, involving around 40 different property developers.
The overall distribution is 52% rental apartments and 48% tenant-owner apartments. Of the rental apartments, 8% are student housing and 2% are senior housing, see diagram 1.5.
Diagram 1.5 Number of apartments and types of tenure, %
For more details, see appendix table 1.4.
All phases contain a variety of apartment sizes. The distribution is approximately 10% one-room apartments, 33% two-room apartments, 29% three-room apartments, 24% four-room apartments and 4% apartments with five or more rooms, see diagram 1.6. This creates the conditions for households of different sizes and for people with different socio-economic backgrounds to settle in Stockholm Royal Seaport.
Diagram 1.6 Apartment sizes
To further promote social inclusion and a broad demographic composition, requirements are set in upcoming land allocations. In the Terrasskvarteren blocks and Gasklocka 4, property developers are planning, for example, communal spaces that will create meeting places across generations and the possibility of co-ownership concepts, see appendix table 1.5.
Mixed use development is a central part of a safe and vibrant district. So far approximately 46,000 m² of commercial space have been completed, see diagram 1.7, which corresponds to around 21% of the total completed floor area. The area includes, among other things, nine preschools, a primary school, a sports hall, a pharmacy, a museum, a grocery store and a library. The primary school offers approximately 28 places per 100 homes and the preschools 21 places per 100 homes. The share of premises floor area will increase as further development continues in Ropsten, Gasverket and Värtahamnen.
Diagram 1.7 Functional mix
According to the resident survey from 2023, 9 out of 10 residents say that they feel safe in the area, regardless of gender. This indicates that the district's design and functional mix contribute to a perceived safe and inclusive urban environment.
In 2025, two safety walks were carried out by the district administration; 29 people took part, and measures will be implemented to further increase safety.
2. Accessibility and proximity
Stockholm Royal Seaport is characterised by dense and cohesive urban environments where buildings and greenery interact. The public realm quality is prioritised and the street environments are designed to be safe and secure. The street space is used efficiently and equitably by giving priority to walking, cycling and space-efficient, high-capacity modes of transport. This contributes to better health and mobility at lower cost in a more equitable way.
The area is served by the metro, several bus lines and several electrically powered commuter boats, which makes it easier to use public transport. Everyday services such as schools, preschools, grocery stores and public transport are within five minutes' walking distance, which makes it easier to live without a car. The Construction Consolidation Centre also contributes to improved traffic flow during the construction period.
Street space for activity and urban life
The streets in Stockholm Royal Seaport are designed to be more than just places for vehicles and parking. The ambition is to create lively and inviting environments where people can move, meet and spend time. Greenery, seating and thoughtful street furniture strengthen urban life and well-being.
Continuous and accessible pedestrian routes are built along streets and quays, with a particular focus on safety and good lighting. Cycle routes are separated from other modes of traffic to ensure that both children and adults can cycle safely and comfortably.
In the first phases, visitor parking has been provided along the streets. In upcoming phases, residents and visitors are directed to shared parking facilities, which frees up space in the street for activity and greenery.
Since the district is a construction site over a long period, particular attention is given to safe and accessible pedestrian and cycle paths. This is particularly important for children on their way to and from school and leisure activities.
Cycling and traffic measurements 2023
In 2023, cycle counts were carried out at three locations in Hjorthagen. At each measurement point, between 2,300 and 2,400 cyclists passed per weekday, with average speeds of 22–24 km/h. On Bobergsgatan, approximately 3,600 vehicles per weekday were recorded, with an average speed of 27 km/h. Husarviksgatan recorded significantly lower traffic flow, approximately 55 vehicles per weekday and an average speed of 18 km/h.
The resident survey from 2023 shows that:
- residents are satisfied with the access to pedestrian and cycle paths and the ability to reach nearby areas on foot or by bicycle.
- there is still potential for improvement when it comes to traffic safety for pedestrians.
- 80% of households have at least one bicycle, which is usually parked in a bicycle room.
- 73% are satisfied with public transport, and women are generally more satisfied than men. A quarter of residents use public transport at least five days a week during the winter months, compared with 18% in the summer. At the same time, 73% travel at least once a week in winter and 67% in summer.
The five-minute city
Stockholm Royal Seaport is planned according to the five-minute city principle. This means that grocery stores, public transport, preschools and schools should be within five minutes' walking distance from home, corresponding to approximately 400 metres, see the interactive map below.
Everyday Services & Public Transport
Interactive map: the five-minute city
On the interactive map, you can move a marker to different locations in Stockholm Royal Seaport and see how far you can reach within a 5-minute walk to schools, preschools, grocery stores and public transport.
A complementary principle is that all residents should have access to a park within 200 metres, which particularly benefits children and the elderly.
Cycle and car parking spaces
In the district, good conditions for sustainable travel are created by prioritising cycle parking spaces and limiting the number of car parking spaces. For completed apartments, the number of cycle parking spaces is between 1.8 and 2.7 per home and car parking spaces are 0.5, see diagram 2.1. The share of cycle parking gradually increases between phases. In all phases, cycle parking is provided on private plots and car parking in underlying garages.
Diagram 2.1 Car and cycle spaces per apartment, by phase
Gasverket västra consists largely of existing buildings of cultural and historical value. This means limited space within the properties and that underground parking could not be provided beneath the buildings. It has therefore only been possible to create a small number of cycle parking spaces on the developers' plots. Some cycle spaces are therefore also located on public spaces. The remaining need for additional cycle parking, as well as the need for car spaces, will be met in garages within Gasverket östra. In Norra 1 and Västra, requirements were voluntary and the data has not been verified. For more details, see appendix tables 2.1–2.5.
In the first phases, visitor parking for cars and bicycles is provided along the streets on public space, see diagram 2.2. In total, there are 33 car-pool spaces with electric charging along the streets.
Diagram 2.2 Visitor parking on public space
Visitor parking for bicycles and cars on public space is provided in appendix table 2.3.
Car parking in upcoming phases is placed further from the apartments to reduce car dependency and free up space. The Hjorthagen car park is being built in a rock cavern in Hjorthagsberget and will accommodate approximately 1,000 parking spaces, all prepared for electric charging. Similar solutions are being studied for Värtahamnen and Loudden.
Experience from the first phases shows that the quality of mobility services is decisive for the traffic hierarchy to work in practice. This has led to the development of the mobility index tool, inspired by the city's work with the Green Space Index. With the mobility index, property developers can choose measures that promote walking, cycling, deliveries and various mobility services. The tool was used for the first time in the Södra Värtan norra detailed development plan, where mobility issues are handled in an integrated way.
For more detailed information and verification of data, see appendix tables 2.1–2.5.
Construction and mass logistics
Goods transport is being made more efficient to improve accessibility, traffic safety and create safer street environments. Local construction and mass consolidation centres have been crucial in reducing the number of heavy transports during construction. The Construction Consolidation Centre was procured through competitive dialogue and it is mandatory for all property developers and the city's contractors to join the scheme.
Transports with a fill rate above 50% may be driven directly to the construction site, while others are consolidated and transported onwards by route truck. The average fill rate amounted to 49% in 2025 (target 50%). Checks have shown that the fill rate has varied greatly. In 2026, the aim is to carry out more checks to improve statistical follow-up and increase compliance with the requirement. The consolidation rate was 81% (target 75%). It varies with the pace of construction and the volume of transports. In recent years, the centre has mainly handled materials for public space, with fewer but larger deliveries directly to the construction site, see appendix table 2.6.
The Mass Consolidation Centre enables local reuse of rock and excavation masses and creates the conditions for circular mass flows, which reduces the need for heavy transports through the inner city. In 2025, the number of avoided lorry transports was halved compared with previous years, mainly because fewer masses were handled within the ongoing contracts, see diagram 2.7.
Diagram 2.7 Avoided lorry transports using the Mass Consolidation Centre
The Mass Consolidation Centre also receives rock masses from the metro expansion and from other projects in Stockholm. At the centre, excavated rock is crushed and transported back to the projects by barge. In 2025, 66,600 tonnes of crushed rock were transported back in this way, corresponding to over 5,100 lorry transports. When transports are shifted from road to water, noise, road wear, air pollution and traffic risks in the inner city are reduced.
3. Resources: Waste management
In Stockholm Royal Seaport, waste is regarded as a resource. The aim is first and foremost to prevent the generation of waste, with any waste that does arise being reused or recycled as far as possible. As little as possible should go to landfill. Waste management is designed to make it easy and clear for both households and businesses to sort correctly.
Household and business waste
In Stockholm Royal Seaport, the waste system for both households and businesses includes several solutions: pneumatic waste collection, environmental rooms and a mobile reuse station. From 2025 onwards, food waste is placed separately in residual waste for optical sorting in Högdalen.
In the pneumatic waste collection system on private plots, four fractions are sorted directly into the inlets: newspapers, plastic packaging and residual waste including food waste. A waste composition analysis from 2024 shows that sorting in the local pneumatic waste collection system has improved, which indicates that the system is working efficiently and contributes to increased resource recovery.
Over a ten-year period, the amount of newspapers and plastic packaging collected has decreased. Residual waste from households and businesses has decreased by 40% compared with 2014. The increase in 2024 and 2025 is due to the fact that food waste is now placed in the residual waste, see diagram 3.1.
Diagram 3.1 Waste volumes, pneumatic waste collection, kg/person and year
To make things easier for residents, pneumatic waste inlets must be located no more than 30 metres from the entrances. In Brofästet, exceptions have been approved for a few stairwells as well as for the urban townhouses, due to the design of the block, see appendix table 3.2.
76 litter bins on public space are connected to the pneumatic waste collection system. Since 2024, Stockholm Vatten och Avfall has been responsible for the pneumatic waste collection facility in Hjorthagen.
Environmental rooms must be provided for the waste types that cannot be handled via pneumatic waste collection, and be planned no more than 50 metres from the entrance. This requirement is met by all property developers, see appendix table 3.3.
For collection of bulky waste that can go to reuse, the mobile reuse station Pop-up Reuse visits the area. Pop-up Reuse originated in an innovation project in Stockholm Royal Seaport. The concept was developed further and then became part of Stockholm Vatten och Avfall's regular operations. In 2025, approximately 7,150 people visited the Pop-up on two different occasions in Stockholm Royal Seaport. 13,700 items changed owners and 4.8 tonnes of material went to reuse. In addition, 4.4 tonnes of bulky waste, 1.2 tonnes of electronics and 0.7 tonnes of hazardous waste were collected. In total, 78,400 items have been handed in and 41 tonnes have gone to reuse, see appendix table 3.4.
In addition to this, the area was visited by the Return Round six times. In total, 950 people handed in their items, of which 6.1 tonnes went on to reuse.
The resident survey from 2023 shows that almost all residents sort newspapers, paper, glass, metal and plastic packaging.
Construction waste
Property developers are responsible for reducing the generation of construction waste. The result varies: from 25 to 158 kg/m² GFA. So far, a total of 17,000 tonnes of construction waste has been generated. The variation is due partly to the fact that property developers have not worked sufficiently proactively with waste prevention measures at the design stage, and partly to inadequate quality assurance during the construction phase, see diagram 3.1 and appendix tables 3.5–3.7. Statistics from Norra 1 and Västra have not been reviewed by the city. Construction waste from Norra 1 has only been reported as construction waste. In the renovation of the buildings of cultural and historical value in Gasverket västra, demolition waste has not been reported separately. In upcoming phases, all property developers must therefore prepare a waste plan.
Diagram 3.2 Construction waste from property developers, per phase, kg/m² GFA
The city's contracts mainly generate waste consisting of metal, wood, combustibles and concrete during construction. A large part of the waste that goes to energy recovery consists of formwork timber. Before 2022, construction waste was not separated from demolition waste. The amount of mixed and combustible waste has generally decreased in recent years, but sorting can still be improved. Going forward, the Construction Consolidation Centre will provide increased support for correct waste sorting. In 2025, 560 tonnes of construction waste were generated, see appendix table 3.8.
Demolition waste that goes to landfill is usually contaminated, normally as a result of previous industrial activity on the site. In 2025, a total of 4,870 tonnes of demolition waste arose, see appendix table 3.9. The majority of the demolition waste consists of asphalt from the final landscaping of Södra Värtan norra.
A few existing buildings have been demolished, mainly due to poor technical condition. A reuse inventory is always carried out before demolition to ensure that as much material as possible can be reused at a later date. In 2025, 1,360 tonnes of demolition waste from buildings were taken care of, see appendix table 3.10.
Reuse of buildings and construction materials
Within Gasverket, several historically valuable buildings are being preserved and developed. The work focuses on careful renovation and buildings are given new functions. In 2025, the renovation of Gasklocka 2, the future cultural venue Gasometer, continued, while preserving its industrial character. Damaged brick has been replaced, windows have been restored, concrete remains and formwork timber have been reused.
In Gasklocka 1, selective dismantling has been carried out to preserve the cultural-historical expression. A selection of windows has been saved for future use, while damaged windows have gone to external reuse. The internal gas pipe system has been taken down, decontaminated and preserved to be remounted as a design installation. The brick façade and granite plinth have been renovated and damaged material has been replaced where needed. Removed brick and stone in good condition can be reused.
A few existing buildings have been demolished, mainly due to poor technical condition. In 2023, a reuse warehouse was opened within the framework of the Construction Consolidation Centre, which makes it easier for property developers and the city's contracts to use leftover material.
Reuse of materials is a priority and in 2025 materials have been reused or dismantled within Stockholm Royal Seaport in various contracts, see appendix table 3.11. The reuse mainly covers smaller components and limited areas for both public space and buildings. In upcoming land allocations, requirements are set that a certain proportion of reused and recycled building materials must be used.
Resources: Water and wastewater
In Stockholm Royal Seaport, water use is being reduced while wastewater management is being planned for source separation. This contributes to protecting the sea against eutrophication, recovering waste energy and nutrients, and ensuring a long-term secure drinking water supply.
The water and wastewater management of the future
In Stockholm Royal Seaport, planning is in place for efficient water use and an advanced wastewater management system in which different wastewater fractions are separated at source. Several research and development projects have investigated the potential of a wastewater system in which greywater and blackwater are separated and recovered.
Treated greywater is planned to replace drinking water for irrigation. Plant nutrients from blackwater can be recovered and replace artificial fertiliser in the management of the city's green structure. Recovery of waste heat and biogas are also important resources in an optimised energy system.
A pilot project is planned within the Saltkvarteren detailed development plan, where greywater is to be sorted and treated in Saltparken and then used for irrigation. The possibility of introducing urine separation for the production of urban fertiliser is also being explored. Within the project "Regenerative Vital Water for European Cities" (REV:EU), the need for technology development, the design of the technical system, organisational issues and a socio-economic assessment are being investigated.
Water use during construction production
Water is used in construction for various activities within the contracts. Between 2024 and 2025, water use increased by 13%, see appendix table 3.12. More than half of the total water volume has been used in the soil remediation at Kolkajen. The Mass Consolidation Centre uses water for wet sieving of masses. Through a local treatment process, all water can be reused.
The need for irrigation of the green structure has increased in recent years as a result of longer dry periods during the growing season.
Resources: Energy
In Stockholm Royal Seaport, energy demand is reduced primarily. Secondly, measures are taken to increase the production of renewable energy. Local solar energy is produced on rooftops and the surplus is fed into the electricity grid. On construction sites, fossil-free and emission-free fuels are used for transport and machinery. Together, this contributes to the development towards a fossil-free and climate-positive Stockholm.
Energy use and local production of solar energy in buildings
In Stockholm Royal Seaport, requirements are set for high energy performance, but property developers can choose their own energy source. The buildings have well-insulated building envelopes, energy-efficient installations and control systems that together ensure low energy use and high performance. According to the resident survey 2023, one third of households use eco-labelled electricity. Just over 94% of the buildings are connected to the existing district heating system, while the rest use heat pumps for heating.
Stockholm Royal Seaport has for a long time applied its own requirements for energy use, expressed as specific energy use and net energy. To harmonise with the Swedish National Board of Housing, Building and Planning's regulations (BBR), requirements on primary energy values (PET) were introduced in 2024. To ensure comparability, results in this document are henceforth reported as PET, see diagram 3.3.
In the first phase with binding energy requirements, Norra 2, the energy performance is 53 kWh/m² Atemp, which is 30% lower than BBR29.
For Brofästet, the corresponding value is 60 kWh/m² Atemp, representing a level 19% lower than BBR29. To test the plus-energy building concept, a land allocation competition was carried out in this phase in 2017. In 2025, the building had a plus of 0.5 kWh/m², which was made possible by system integration (geothermal heat, wastewater heat exchanger and solar PVs) along with careful follow-up from design through to operation.
Energy use in the historic buildings in Gasverket has decreased by approximately 79% compared with the originally calculated level, which exceeds the requirement for existing buildings of a 50% reduction. The energy performance of the existing buildings is 82 kWh/m². For the new buildings, which consist of commercial premises, the energy performance is 39 kWh/m² Atemp, 44% lower than BBR29.
In the phases Norra 1 and Västra, no binding energy requirements were set. The energy performance in Norra 1 averages 82 kWh/m² Atemp, which is 10% higher than the BBR29 requirement level. In Västra, the energy performance is 69 kWh/m² Atemp, which is 7% lower than BBR29.
Diagram 3.3 Energy performance per phase, primary energy value, kWh/m² Atemp per year
The metered values are generally somewhat above the calculated values, indicating differences in system choices, operational optimisation and follow-up, see the report Designing, building and managing energy-efficient buildings. Dialogue meetings have been held to identify issues and areas for improvement. Through measures and feedback of lessons learned, the average energy use has decreased by at least 10% after commissioning. For more detailed information, see the appendix tables 3.13–3.17.
Local production of renewable solar energy
To promote local production of renewable energy, requirements are set for buildings to produce solar energy. Almost all property developers meet the requirement. Metered values are 3.6 kWh/m² for housing and 2.9 kWh/m² for commercial premises, see diagram 3.4 and the appendix table 3.18 and 3.19. In 2025, 519 MWh of solar electricity was produced on buildings. All buildings, with the exception of Västra, produce more solar electricity than calculated.
Diagram 3.4 Solar energy production per phase, buildings, kWh/m²
Towards a fossil-free energy system
Experience from the plus-energy buildings shows that the concept is challenging to implement on a larger scale, mainly due to costs and complexity. To reach the goal of a fossil-free and optimised energy system, a holistic perspective at the area level rather than only at the building level is therefore required.
In 2025, a study was carried out together with Stockholm Exergi to investigate how a fossil-free energy system can be achieved through optimisation of energy production and energy use at the area level. This includes harnessing waste heat from the sewage and district heating systems as well as increasing the share of locally produced solar energy. See Research and innovation projects.
Energy use in construction
Energy use in property developers' site huts shall be energy efficient and all electricity used for site establishment and construction sites shall be eco-labelled. Metered energy use for site huts averages around 4,700 kWh/year per hut, see the appendix table 3.20.
Energy use on public land and local production of solar energy
On public land, energy is used mainly for lighting, operation of the pneumatic waste collection system and the Mass Consolidation Centre and Construction Consolidation Centre. LED lighting on pedestrian and cycle paths has halved energy use. Local renewable energy is produced at the city's Mass Consolidation Centre and Construction Consolidation Centre.
Pneumatic waste collection
In 2025, energy use for residual waste was somewhat above the target value. In August 2025, food waste collection was introduced together with residual waste, increasing friction, moisture and deposits in the pipe system. This led to higher pressure drops, more and longer operating cycles, and a lower fill rate per run. This contributed to slightly higher energy use compared with the previous year.
Energy use for plastic packaging was below the target value, while that for newspapers continued to be too high, see diagram 3.5.
Diagram 3.5 Energy use pneumatic waste collection facility per fraction, kWh/tonne
For more detailed information, see the appendix table 3.21.
Lighting
In 2025, energy use for street lighting in Hjorthagen amounted to approximately 171.5 MWh, see appendix table 3.22. Work to make public lighting more efficient continues. New energy-saving measures are planned, including the upgrading of previously non-LED-adapted parts of the installation during the period 2026–2027.
Local production of renewable energy at city facilities
251.1 MWh of solar electricity was produced on the roof of the Mass Consolidation Centre in 2025. This corresponds to about 46% of the centre's energy needs for the screening plant, sorting plant, lighting, water treatment, ventilation and electric truck. In 2025, additional solar PVs with a capacity of 470 kW were installed on the roof. At the Construction Consolidation Centre, 30.8 MWh of solar electricity was produced in 2025, covering about 9% of the energy demand for the electric truck, lighting and ventilation. The solar PV installation was completed in 2022, see the appendix table 3.23.
Energy use during construction
Energy use during construction varies depending on the number and type of contracts. The statistics also include energy use at the Mass Consolidation Centre and Construction Consolidation Centre and the contracts. In recent years, extensive groundworks, tunnelling and remediation works have been carried out. The construction of Saltkajen, the tunnel in Ropsten and the soil remediation in Kolkajen have accounted for the largest energy use. In 2025, the tunnel works accounted for nearly 50% of total energy use, see diagram 3.6.
Diagram 3.6 Energy use construction production, public land, MWh
For more detailed information, see the appendix table 3.24.
Resources: Climate
New construction of infrastructure and buildings entails significant climate impact during the construction phase, both from the production of materials and from the construction process as a whole. In Stockholm Royal Seaport, this climate impact shall be reduced to the greatest extent possible. Transport contributes to climate emissions, and the conditions must be created to enable electrification.
Climate analysis of detailed plans
In order to identify opportunities to reduce climate impact from the built environment as early as possible, overarching climate analyses are carried out already at the detailed plan stage. The analyses make visible which structures and measures drive the greatest climate impact, and provide a basis for further work at the design stage, where construction solutions and technical solutions are optimised. During procurement, targeted climate requirements are then placed on selected materials and works.
The first climate analyses were carried out in 2022 and showed that the design of the area has a significant influence on climate impact. Climate-driving measures include, among other things, expansion into water, remediation and stabilisation of existing filled land, and heavy infrastructure such as bridges and land filling. The analysis also shows that significant improvements can be achieved starting at the detailed plan stage, where the choice of structure, foundation and remediation methods has the greatest effect.
A climate analysis for the sub-area Södra Värtan, which covers the detailed plans Södra Värtan norra, Saltkvarteren and Södra Värtan södra, was completed in 2025. Since implementation work in the area began as early as 2016, the analysis covers completed, ongoing and designed contracts as well as an area that has not yet been designed. To make the area adjacent to Värtapiren, while maintaining regular ferry traffic, buildable and safe extensive infrastructure work has been required, including a small expansion into the water and renovation of a quay section. The climate analysis shows that material use, mainly steel and concrete/cement, accounts for just over 90% of the climate impact in all contracts, see diagram 3.7.
Diagram 3.7 Climate impact, Södra Värtan
Since the heavy infrastructure contracts were designed long before, and several works were completed before the climate analysis was carried out, the opportunities to reduce climate impact through measures at the design stage have been limited.
During the construction of Saltkajen, however, development work was carried out in collaboration between the city's administrations and the contractor. The measures included replacing concrete with crushed rock material in parts of the structure, as well as using climate-reduced concrete previously tested in full-scale trial casts in a water-filled container. This resulted in both a cost saving of approximately SEK 2 million and a reduction in climate impact of more than 2,200 tonnes CO₂e, see appendix table 3.25. The innovation work received the Swedish Concrete Association's Climate Prize 2025.
A climate analysis has also been prepared for the Ängsbotten detailed plan as a basis for the system design phase. The area is being built on former seabed, which from the outset entails extensive piling. At the system design stage, measures and alternative solutions will therefore be investigated to reduce climate impact.
Early climate analyses prove to be important tools for identifying measures at an early stage and guiding the further design. Through cooperation between administrations and an open approach to new solutions, conditions are created for innovative and cost-effective measures that reduce climate impact. See also the section on innovation work.
Climate impact public land: product stage, construction process and operation
Climate calculations shall be carried out on public land for all projects, from programme to as-built documentation. A calculation tool has been developed, and in the procurement of contractors, climate requirements are placed on concrete, reinforcement and asphalt, along with requirements for renewable fuels for machinery and transport within the area.
Climate calculations for four completed detailed plans show large variations depending on the need for ground reinforcement measures, between 52 and 518 kg CO₂e/m². The lower result comes from a detailed plan with relatively standard construction work for streets and parks. The higher result is from a detailed plan with extensive ground reinforcement measures, see diagram 3.8 and appendix table 3.27.
Diagram 3.8 Climate impact, kg CO₂e/m², public land
In 2025, climate calculations for four design projects were carried out and an action plan was drawn up, see the appendix table 3.27.
Continued development work
On concrete slabs for staircase foundations, full-scale tests have been carried out with Minibars, a fibre reinforcement with basalt rods that replaces slack reinforcement. Traditionally reinforced slabs must, according to the Technical Handbook, be 330 mm thick to prevent the reinforcement from rusting. Since fibre reinforcement does not rust, the slabs can be 100–200 mm thick, which reduces climate impact by 40–70%, mainly through reduced concrete consumption. As the slabs are placed in a permanent staircase, evaluation will be done by studying any settlements over time.
Other projects within the City Development Administration use Stockholm Royal Seaport's methods for climate calculations on public land. Further development of the calculation tool has been carried out in cooperation with users. A systematic exchange of experience and knowledge is ongoing.
Climate impact from energy use in construction and operation
Stockholm Royal Seaport's contracts use 100% renewable electricity, both for site hut establishment and electric machinery. The use of renewable fuels for vehicles and machinery has increased sharply in recent years, from only 3.7% in 2019 to just over 96% in 2025, see diagram 3.9. The high share of renewable fuels consists almost exclusively of the transition from diesel use to HVO100 (renewable diesel).
Diagram 3.9 Share of renewable fuels, %
Climate impact from vehicle fuels and electricity use in the contracts amounted to 267 tonnes CO₂e in 2025, a reduction of 1,168 tonnes CO₂e, more than 80%, compared to if fossil fuels had been used, see appendix table 3.28.
To facilitate the transition, two HVO100 fuelling stations have been established in the area. Since 2021, the project has had an electric truck for transporting building materials via the local Construction Consolidation Centre. In 2023, two electric dump trucks were procured for internal mass transport within the city. In 2025, the project added an electric wheel loader and another dump truck for mass transport. In relevant procurements, requirements have been placed on compaction machines and a permanently stationed excavator to be electrically powered. Projects are underway to identify and investigate user patterns and factors that affect the interaction between the electric truck, energy storage system and solar PVs.
A procurement strategy for electric transport and machinery has been developed in collaboration with the industry. The strategy includes mapping of future power needs and charging infrastructure.
The local Mass Consolidation Centre also contributes to shorter transport distances for masses from Stockholm Royal Seaport's contracts, and to barge transport of excavated material from the Region Stockholm's (Administration for Extended Metro) metro expansion. So far, the Mass Consolidation Centre has resulted in a total climate impact reduction of 3,740 tonnes CO₂e, of which 390 tonnes CO₂e in 2025. The Construction Consolidation Centre contributes emissions of 23 tonnes CO₂e and the Mass Consolidation Centre 26 tonnes CO₂e, see the appendix table 3.32.
On public land, electricity is used for the operation of pneumatic waste collection and lighting. The climate impact from energy use is 7 tonnes CO₂e for lighting and 4 tonnes CO₂e for the pneumatic waste collection.
Carbon sinks
Carbon sinks are materials that store, or vegetation that naturally absorbs, carbon dioxide. In Stockholm Royal Seaport, this consists primarily of biochar in plant beds and planted trees. Most of the plantings along the streets have a growing substrate consisting of macadam mixed with biochar. The biochar comes from Stockholm residents' garden waste and also contributes as a soil improver. By using biochar, a carbon sink has been created, so far sequestering the equivalent of 5,440 tonnes CO₂, see the appendix table 3.29. The 654 newly planted trees also absorb approximately 13 tonnes CO₂ annually.
Climate impact property developers: product stage, construction process and operation
Since 2016, property developers have carried out climate calculations at the design and construction stages, and prepared an action plan with measures to be taken to reduce climate impact in the next stage. Starting in 2023, requirements with limit values have been in place, and a common calculation guideline has been developed to ensure comparability.
So far, climate calculations and action plans have been reported for eleven buildings, see diagram 3.10. In most projects, the climate improvements are primarily linked to system or material choices in the load-bearing structure. Common measures are requirements for prefabricated elements, climate-improved concrete and hybrid solutions with timber modules.
Diagram 3.10 Climate impact buildings, kg CO₂e/m² GFA
Property developers that received land allocations before 2024 were not covered by any limit value requirements, but only by requirements to carry out climate calculations. The results from these projects are therefore not directly comparable with calculations from later phases, see the appendix table 3.30.
Climate impact from operation
In total, 34.8 GWh of district heating, building electricity, household electricity and cooling are used for the operation of buildings. This produces a climate impact of 1,740 tonnes CO₂e, corresponding to 5 kg CO₂e/m² Atemp, see appendix table 3.31. According to the resident survey from 2023, 30% of households state that they have contracts for eco-labelled electricity.
Charging infrastructure
Electrification is a central part of the transition away from fossil fuels in the transport sector, and access to charging infrastructure is decisive. All parking spaces on private land shall be prepared for electric vehicles charging in garages.
At present, 16% of car parking spaces on private land have charging facilities. The share varies between sub-areas, and spot checks show that in individual buildings up to 100% of parking spaces are equipped for charging. In Gasverket västra there are no car parking spaces on private land, but these will be established in Gasverket östra. In Hjorthagsgaraget, all parking spaces will be prepared for charging.
Within the area there are also 33 charging spaces for car-pool vehicles and one fast-charging station, see the appendix table 3.33 and tables 2.1–2.5.
Resources: Materials
Stockholm Royal Seaport is being built on former industrial land that requires extensive remediation. The land is cleaned to levels that ensure it does not pose a risk to human health or the environment, which also reduces the load on surrounding water environments. The ground preparation works mean that large amounts of excavated and rock materials need to be handled, which entails significant transport and costs.
Soil remediation
The area has historically housed gasworks, oil depots and harbour operations, among other things. These activities have caused soil contamination that is now being addressed through remediation. To date, approximately 30% of the area has been fully remediated. In the first phases, contaminated soil was excavated and transported to external receiving facilities.
In Kolkajen, part of the former gasworks area, an innovation procurement was carried out in 2017 for in-situ remediation, with the aim of testing a number of different in-situ techniques and treatment methods for remediating contaminated soil on site, and thereby reducing costs and transport. In Kolkajen, a combination of several different in-situ methods is used, including chemical oxidation (persulphate and lye), biological degradation and the installation of active carbon filter barriers to prevent the spread of contaminants, see appendix table 3.34.
In 2025, the area west of Stockholm Exergi's heating plant has been remediated. A protective barrier has been installed adjacent to the heating plant to prevent recontamination from contaminated groundwater. The area east of the heating plant has also been partly remediated, as well as parts of Gasverket östra, Bobergsgatan and Terrasskvarteren.
Mass logistics
Ground works and remediation entail handling of large amounts of excavated and rock materials, which would otherwise mean extensive transport and high costs. Already in 2013, a crushing station was set up where approximately 720,000 tonnes of rock materials were taken in and crushed for reuse. In 2018, a local Mass Consolidation Centre opened where rock and excavated materials can be handled and treated within the area. As part of this, the crushing station was moved to the Mass Consolidation Centre. In 2024, a wet screening plant was put into operation, which increases the possibilities for reuse of masses.
In 2025, 100% of the rock materials and 43% of the excavated materials were sorted out for reuse. The remaining masses were transported to external receiving facilities. The reason masses cannot be reused is mainly that they contain too much clay, or constitute a sticky, hard-to-remediate contamination that is difficult to wash away. The Mass Consolidation Centre also receives rock materials from other urban development projects and from Region Stockholm's metro expansion.
To date, approximately 1,576,000 tonnes of masses have been handled, of which 1,120,000 tonnes have been reused in contracts and 456,500 tonnes have been stored, see diagram 3.11 and 3.12.
Diagram 3.11 Masses handled at the Mass Consolidation Centre, tonnes
Diagram 3.12 Flows in and out of the Mass Consolidation Centre, tonnes
For more details, see the appendix table 3.35.
In 2025, the reporting shows that approximately 8.7% of the masses come from contracts within Stockholm Royal Seaport, while the remaining volumes come from other projects. Of the recycled rock and excavated materials, 45% have been returned to projects in the same year, and the remaining part has been stored for future use, see illustration 3.1.
Illustration 3.1: Masses in and out of the Mass Consolidation Centre, 2025
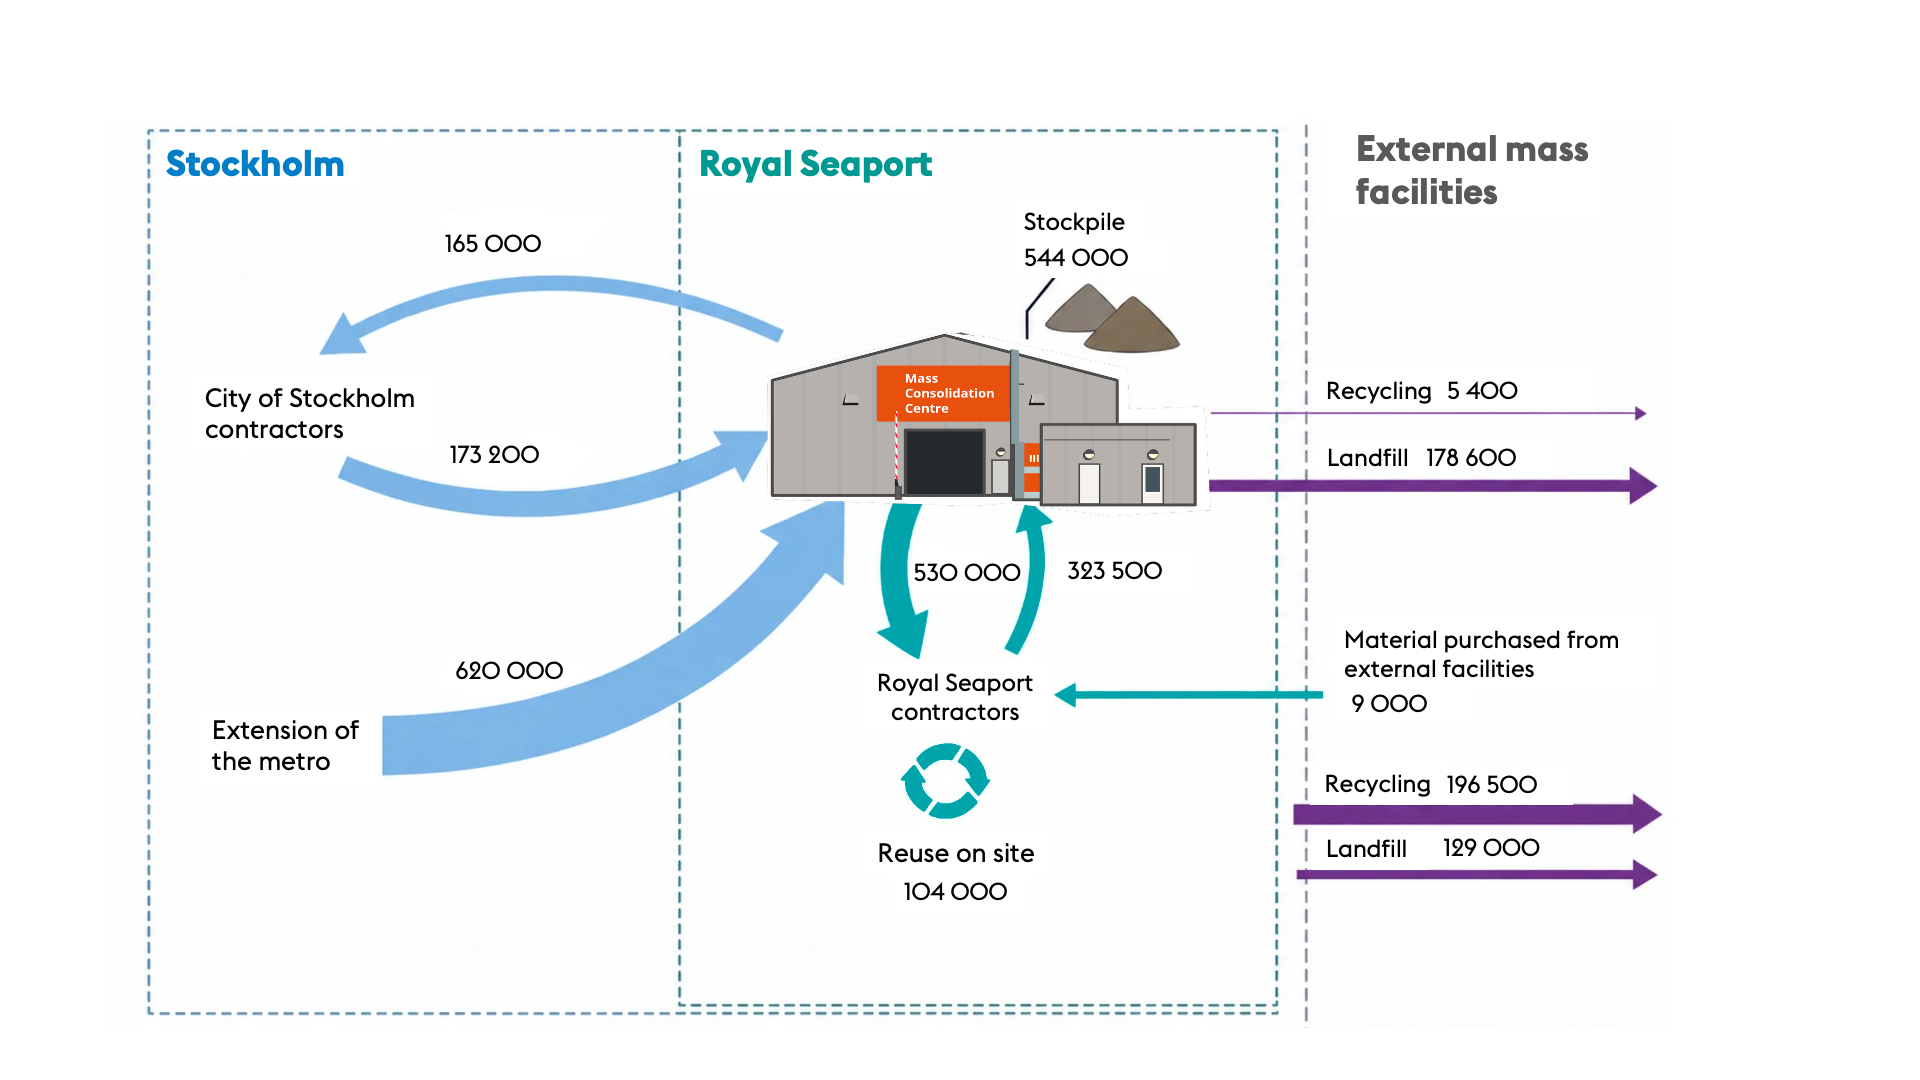
The local Mass Consolidation Centre has reduced the cost of mass handling by at least 20%, mainly through shorter transport distances (approximately 2 km compared with 35 km) and reduced landfill costs. Without the Mass Consolidation Centre, the cost would amount to approximately SEK 500 per tonne. The saving is approximately SEK 100/tonne at a 40% recycling rate and SEK 250/tonne at an 80% recycling rate, see appendix Cost analysis Mass Consolidation Centre
Material choices and indoor environment
Materials built into the area are assessed based on chemical content and ethical, environmental and economic aspects, including life-cycle costs. Materials containing particularly hazardous substances are not allowed. The use of finite resources is limited.
Chemical content in building materials
All building products are documented and checked for chemical content in national building material assessment schemes such as Byggvarubedömningen or equivalent. On public land, 97% of installed building products have been assessed. Of these, 96% have been classified as "recommended" or "accepted", see diagram 3.16.
Lighting products are not included in the statistics because they often lack assessment, as they consist of many components and the technology develops rapidly.
Diagram 3.13 Number of registered products, public land
On private land, 99% of the products are assessed, of which 88% have been classified as "recommended" or "accepted". The products that should be avoided consist mainly of chemical products with allergenic or environmentally hazardous properties and installation products containing lead, see diagram 3.14. All deviations have been approved by the city, as no adequate alternatives were available.
Diagram 3.14 Number of registered products, private plots
Environmental, ethical and economic aspects in the choice of materials
Natural stone used on public land shall meet ethical requirements and be produced in accordance with international conventions on working conditions. All contracts meet the requirements. Wood products shall come from sustainable forestry and be certified according to FSC or PEFC. For selected products, life-cycle cost analyses have been carried out, such as for fall protection, waste bins linked to the pneumatic waste collection system and different types of wood for site-built outdoor structures.
Natural gravel, pebbles or natural sand may not be used in site-cast concrete but shall be replaced with recycled, for example crushed, material. All contracts have met this requirement. The city is now investigating how the same requirement can be set on prefabricated concrete.
Indoor environment
The buildings shall meet the requirements for Miljöbyggnad Gold for indoor environment. About 60% of property developers reach this level, see diagram 3.15. Deviations mainly concern thermal climate in summer, which is affected by a warmer climate and increased solar radiation. Experience shows that early collaboration between architects and indoor environment experts is decisive for achieving good results.
Diagram 3.15 Miljöbyggnad indoor environment, per phase
For more details, see the appendix table 3.36.
A resident survey from 2023 shows that 93% are satisfied with the access to daylight, 83% with air quality and 68% with the temperature in the dwelling. At the same time, 64% experience it as too cold in winter and 41% as too warm in summer.
4. Let nature do the work
In Stockholm Royal Seaport, regenerative and nature-based solutions are used to reduce the risks from intense rainfall, drought and heatwaves. Water and greenery serve several important functions. The carefully considered blue-green structure delivers ecosystem services, creates positive synergy effects and strengthens the area's resilience to climate change, while at the same time contributing to health and well-being.
Parks, streets and residential courtyards are designed to accommodate several functions on the same space. They offer meeting places for activity, play and recreation, provide shade and coolness during warm periods, and reduce the risk of flooding. The varied vegetation strengthens biodiversity and creates dispersal routes for insects and other animals. To date, approximately 140,000 m² of green areas have been created in the form of parks, green corridors, roofs and courtyards.
Stormwater and green structure – public land
Stormwater
The area's height setting allows stormwater to be led superficially to the recipients Husarviken and Lilla Värtan. Due to previous industrial activity, however, infiltration into the ground is not permitted, as there is a risk of spreading remaining contamination after remediation.
Stormwater is managed in an integrated system that includes green roofs in interaction with courtyards, streets, grass areas, rain gardens, ponds and stormwater pipes.
In Gasverket and Värtahamnen, stormwater management is particularly challenging. The areas are low-lying and relatively flat, with buildings of cultural and historical value to be preserved. Gasverket's large share of hard surfaces makes water management more difficult. In Värtahamnen, low points have been identified where water risks pooling during heavy rain and causing damage. To address this, a stormwater tunnel has been built for rapid discharge.
On public land, stormwater is managed through a connected system of rain beds, plant beds, ponds and parks. Water from streets and parks is led to rain and plant beds, which can both store large amounts of water and create good growing conditions, see appendix table 4.1. To date, 1,150 m³ of rain beds and 17,600 m³ of plant beds have been constructed.
The sunken rain and plant beds are built up of carbon macadam or pumice soil with high permeability. Excess water is led on to the recipient. The construction provides a relatively dry growing environment, which entails a need for artificial irrigation. Longer dry periods therefore pose new challenges. The innovation project "Grey becomes blue" has examined the possibility of using treated greywater for irrigation, with good results.
Ecological connections
Stockholm Royal Seaport has a strategic location between the northern and southern parts of the National City Park and plays an important role in strengthening the connections between these areas. The National City Park contains one of the Nordic region's largest contiguous oak landscapes with high natural values and trees of special conservation value.
Green corridors and surfaces in the district strengthen the area's natural values and function as dispersal corridors. Existing oaks are preserved and new ones are planted. A special frog tunnel has been built to link wet corridors and ponds. Boxes for pollinators, birds and bats are set up in courtyards and on roofs.
The marine environments are also important. Surveys in Lilla Värtan at Kolkajen and Ropsten show limited plant and fish life. Measures will be taken to strengthen marine biodiversity.
To increase resilience to disease, a high diversity of species is planted. On public land, 640 new trees of 20 different species have been planted, including 120 oaks. In some parts of Gasverket, the industrial character has been prioritised, which has limited the possibilities for greenery.
A 2023 insect study shows that green corridors and roofs function as dispersal routes between the National City Park and Hjorthagsberget. Preserved oaks are particularly important for the movement of insects. The results are used in the continued planning, both locally and in other parts of the city.
Improved water quality and bottom sediments
The bottom sediments in Husarviken north of Hjorthagen are contaminated following previous industrial activity. An investigation showed that the contamination situation in surface water and sediments does not pose an elevated health risk for the planned area development. However, eutrophication, bottom conditions and contaminants in the sediments can limit certain bottom-dwelling species, even though the bottom fauna does not differ significantly from other parts of Stockholm's inner waters. To reduce risks, sun jetties that restrict swimming access have been built..
When the water areas at Kolkajen and Ropsten are remediated, the contaminant levels in the sediments will decrease, which in the long run will improve water quality in Lilla Värtan. The ongoing soil remediation on land also reduces the input of contaminants via groundwater.
Stormwater and green structure, private land
Stormwater
Stormwater on private land is managed through green roofs in interaction with residential courtyards. In the early phases, stormwater needed to be delayed on private land, described by a runoff coefficient. Only Norra 2 and Jackproppen's housing comply with the requirement. In later phases, stormwater systems shall be dimensioned to locally delay and treat 20 mm of rain from all hard surfaces, see the appendix table 4.2.
Multifunctional green structure
The requirement for Green Space Index (GSI), in combination with the stormwater strategy, promotes solutions that integrate biodiversity, stormwater retention and social values. Most projects meet the requirements for Green Space Index and use a broad selection of measures. Many courtyards receive particularly high scores in water management and biodiversity. Green roofs, varied plant choices and multi-layered vegetation are common. Trees and shrubs with flowers and berries are prioritised, as are specimen trees and plantings that benefit pollinators.
To date, 26,400 m² of green roofs and 47,300 m² of courtyards have been completed, see diagram 4.1. Jackproppen's playground has a ditch that manages cloudburst risk towards Västra. Green roofs are commonly found, often with sedum and thin growing substrate. More and more roofs are also designed for social activities.
Diagram 4.1 Green Space Index per phase
For more details, see the appendix tables 4.4–4.8.
The limited area of courtyards entails challenges in combining functions. The solutions need to be connected in series so that stormwater is both delayed, treated and irrigates the vegetation. Properly constructed plant beds are required for the green structure share of total and roof area. This places higher demands on early coordination, especially with structural engineers, to ensure that floor slabs and roof structures can handle increased loads.
That said, there are some clear areas for development. The requirement of at least 10 m³ plant bed volume for trees is not always met, especially when trees stand on slabs. Cultivation areas are planned to a limited extent, and to ensure function and longevity, minimum requirements for cultivation area, access to water and composting solutions may be needed. The tool has now been developed to, among other things, stimulate more robust biotope roofs with deeper growing substrate.
In 2025, the innovation project "Tango-W" has investigated the potential for large- and small-scale urban farming. The study's results can contribute to a further development of the Green Space Index with productive ecosystem services, and opportunities for urban farming will be further investigated in the research project on regenerative urban farming. In future land allocations, requirements will be set for the creation of urban cultivation areas.
5. Engagement and learning
Stockholm Royal Seaport uses several methods and platforms to involve civil society in urban development. In addition to the statutory consultation, residents, local actors and other stakeholders are offered the opportunity to participate in both in-person and digital dialogues. In certain detailed plans, special efforts have been made to reach groups that are traditionally difficult to engage.
The development of a sustainable district requires new ways of working and new perspectives. This presupposes collaboration – within the city's organisations, with external actors and together with civil society. Stockholm Royal Seaport functions as a test-bed and forerunner where new knowledge is developed, tried out and disseminated. Lessons learned are taken on board, disseminated and scaled up in other parts of the city.
Citizen dialogue and local initiatives to increase residents' engagement
A consultation has been carried out for the detailed plan Hjorthagskransen, in which 80 people participated. The meeting was preceded by two dialogue meetings on the square by the metro in Hjorthagen, to reach more groups.
In 2025, several activities aimed at children and families living in the area were carried out, such as beehive viewings, Lucia processions and Christmas tree decorating. A gardening event was arranged together with the urban gardening associations that are responsible for the area's 115 cultivation boxes. In Värtahamnen, local actors organised a car boot sale and gardening activities.
Gasverksdagen, which is arranged jointly by CA Fastigheter and the city, offered guided tours and seminars about the area's history and future, as well as a community-run flea market. Visitors also had the opportunity to meet the project organisation and local associations. During the architecture festival Open House Stockholm, 100 people participated in tours of Gasverket. In total, around 7,000 people participated in this year's activities, see the appendix table 5.1.
Pop-up Reuse has so far had 53,300 visitors in Stockholm Royal Seaport, with 7,150 visitors in 2025.
The resident survey from 2023 shows that 80% are aware of the plans for the area, and information is spread mainly via local media, social media, the project's website and newsletter. Almost one third of residents state that they want to be involved in the development.
Research, development and innovation
Stockholm Royal Seaport is a test-bed where research and innovation with a focus on sustainable urban development are conducted. Research and development projects are carried out in an interdisciplinary manner and in close collaboration between the city's administrations, academia, the private sector and civil society. The initiatives aim to develop and validate new ways of working and solutions in areas such as digitalisation, resource efficiency, climate transition and citizen engagement.
To date, around 40 research and development projects have been carried out within the framework of the district's development, see Research and innovation projects. In 2025, four innovation projects were ongoing:
- Reflow examines how the city's resource flows and climate impact can be measured, with support from Smart Built Environment.
- Anchor documents experiences from pilots with source-separating sewage systems together with actors in Hamburg, Ghent, Amsterdam and Helsingborg. The project is financed by Interreg North Sea.
- Optical sorting of excavated masses has been granted funding by the Swedish Environmental Protection Agency. In the facility, construction waste is to be sorted out from the excavated masses. Procurement of equipment is carried out through competitive dialogue, which is to be concluded in March 2026.
- BEAst-standard for digital delivery notes is being tested in the contract E-406 Klockparken, where environmental product declarations (EPDs) are reported digitally for concrete and steel products. The project is being carried out with its own funds.
In 2025, two new projects were granted:
- REV:EU, where tests are to be carried out to collect, treat and reuse greywater for irrigation, and urine to produce urban fertiliser for use in the city's green structure. The project is carried out within the EU initiative Driving Urban Transitions together with actors in Paris and Oslo, and is financed by Formas.
- ”Regenerative urban farming” (an international initiative) has been granted to continue exploring opportunities to integrate urban farming in Stockholm Royal Seaport
Capacity development
Tailor-made seminars and training are arranged on an ongoing basis to meet identified knowledge needs and strengthen understanding of sustainability work. To date, approximately 990 people, from property developers and their consultants, have participated in around 100 different seminars. In 2025, six seminars were held. The city's project staff have participated in over 45 seminars with a total of more than 2,520 participants. In 2025, three seminars gathered a total of around 80 officials. See appendix table 5.1.
All staff working for contractors and other actors with access to construction sites undergo a web-based introductory training covering sustainability, among other things. In 2025, 2,150 people participated, and since 2010, a total of just over 16,000 people have completed the training.
Knowledge and experience dissemination
The development in Stockholm Royal Seaport attracts great interest nationally and internationally. The experiences contribute to knowledge development that can be applied and scaled up in other parts of the city and in other municipalities.
Since the start in 2010, more than 64,200 people have participated in study visits in the area. In 2025, 260 groups were received, with a total of nearly 5,000 visitors, see table 5.1. The visitors consist mainly of officials and decision-makers from other cities and municipalities, but also students, researchers and representatives from organisations and companies. The interest particularly concerns the management of stormwater, excavated masses and soil remediation.
During the year, a digital seminar was also arranged on lessons learned regarding climate impact at the detailed plan stage, with just over 115 participants from municipalities and cities. To date, 1,100 people have participated. Previous lunch seminars are available under Innovations & Knowledge.
Employment for people outside the labour market
An inclusive labour market is central to securing the skills supply within the construction and civil engineering sector. In the property developers' and the city's projects, requirements are set that people who are outside the labour market shall be offered the opportunity for work.
Over the years, 20 people have received fixed-term employment within the city's projects, of which two have moved on to permanent employment. In 2025, five people were employed, of whom two are apprentices, see appendix table 5.2.
Due to reduced construction activity, the property developers have at currently reported limited opportunities for employment initiatives.
∏Achievements »
A table overview of the five goals.
Appendix
The appendix compiles detailed monitoring data from the city's own work and from the property developers in Stockholm Royal Seaport. It also contains background information, requirements and, in certain sections, an overall analysis. Some data come from the design stage and are therefore preliminary.
In the phases Norra 1, Västra and Värtapiren the sustainability requirements were voluntary. The results for these parts are based on the property developers' own reporting and have not been verified by the City of Stockholm.
The resident survey
The first resident survey was carried out in 2013. In 2016, the survey was redesigned and broadened in scope. Since then, it has been carried out every three years. The results from the latest resident survey give an overall picture of how the residents of Stockholm Royal Seaport experience living in the area. Satisfaction with living in Stockholm Royal Seaport is very high and has increased over time. In 2023, 98% stated that they were very or fairly satisfied with living in the area. The share who were very satisfied has increased by 14 percentage points since 2019, see chart 1.1. The aspects with which residents are most satisfied are access to parks, natural areas, squares and meeting places, safety, maintenance and the general range of services.
Chart 1.1 Resident survey - living
How satisfied/dissatisfied are you with living in Stockholm Royal Seaport on the whole?
Access to everyday services is rated positively: 85% are satisfied with access to preschool, 76% with access to school and 92% with places for play for children under 6.
The local environment is highly appreciated. According to the 2023 survey, 9 out of 10 visit parks and natural areas daily or several times a week during the summer months. Satisfaction with access to parks and natural areas is consistently high, and satisfaction with squares and meeting places has also increased over time.
68% are also satisfied with access to grocery shops. For all these areas the share who are satisfied is higher than in 2019. At the same time, some dissatisfaction is expressed regarding the cultural offering and access to indoor social spaces, which points to areas for further development, see chart 1.2.
Chart 1.2 Resident survey - sociotope areas
How satisfied/dissatisfied are you with living in Stockholm Royal Seaport when it comes to...
...access to parks and green spaces?
...access to public squares and meeting places?
The share of residents who travel to and from Stockholm Royal Seaport at least five days a week has decreased since the previous measurement. The share who walk to and from the area is unchanged. Only 15% state that they travel by car 3-4 days a week, regardless of season. Cycling use is high: about 80% of households own a bicycle and 70% park their bicycle in a bicycle room, see chart 1.3.
Chart 1.3 Resident survey - bicycle parking
Where do you park your bicycle at home?
The majority are satisfied with the availability and maintenance of pedestrian and cycle paths. Satisfaction with public transport is increasing, see chart 1.4.
Chart 1.4 Resident survey, pedestrian, cycle and public transport
...access to footpaths/pavements?
...access to cycle paths?
...the ability to walk/cycle to adjacent neighbourhoods?
...public transport?
According to the 2023 resident survey, 68% are satisfied with access to grocery shops, 76% with access to school and 85% with access to preschool. In general, residents are more satisfied compared to earlier years.
In 2023, 80% stated that they were aware of the development plans for the area. Most people obtain information via local media, the area's Facebook page, website and newsletter. Regarding engagement in the continued development, 32% want to participate via social media groups, 27% in consultation and information meetings and 39% are not interested in participating.
Work environment
Table 1.1 Incidents and accidents, number
| 2025 | 2024 | 2023 | 2022 | 2021 | 2020 | 2019 | 2018 | 2017 | 2016 | 2015 | |
|---|---|---|---|---|---|---|---|---|---|---|---|
| Incidents | 51 | 54 | 58 | 28 | 57 | 38 | 49 | 53 | 19 | 16 | 14 |
| Accidents | 17 | 22 | 11 | 8 | 12 | 8 | 12 | 9* | 9 | N/A | N/A |
| Accidents with sick leave | 2 | 6 | 4 | 3 | 4 | 4 | 6 | 2 | 2 | 1 | 3 |
| Risk observations | 249 | 431 | 343 | 112 | N/A | N/A | N/A | N/A | N/A | N/A | N/A |
| Inspection deviations | 537 | 517 | 426 | 320 | N/A | N/A | N/A | N/A | N/A | N/A | N/A |
| Total | 856 | 1,030 | 842 | 471 | 503 | 518 | 771 | 506 | 405 | 73 | 59 |
* In 2018 a fatal accident occurred in one of the contracts.
Table 1.2 Environment-related incidents, number
| 2025 | 2024 | 2023 | 2022 | |
|---|---|---|---|---|
| Incidents | 3 | 7 | 3 | 6 |
| Accidents | 12 | 1 | 3 | 2 |
| Accidents requiring external handling | 2 | 0 | 0 | 0 |
| Risk observations | 16 | 3 | 1 | 1 |
| Total | 33 | 11 | 7 | 9 |
Vibrant city
Table 1.3 Sociotope areas and green oasis
| Norra 1 | Västra | Norra 2 | Brofästet | Jackproppen | Kolkajen | |
|---|---|---|---|---|---|---|
| Sociotope area, % | 28 | 22 | 18 | 12 | 50 | 24 |
| Green oasis, m²/resident | 13 | 5 | 9 | 8 | 65 | 6 |
Table 1.4 Housing units, number and tenure
| Phase | Number of dwellings | Share of tenant-owned, % | Share of rental, % |
|---|---|---|---|
| Norra 1 | 670 | 69 | 31 |
| Västra | 1,257 | 34 | 66 |
| Norra 2 | 598 | 42 | 58 |
| Brofästet | 580 | 56 | 44 |
| Jackproppen (housing) | 54 | 100 | 0 |
| Gasklocka 4 | 364 | 100 | 0 |
| Gasverket östra | 50 | 100 | 0 |
Table 1.5 Description of housing concepts
| Property developer | Description |
|---|---|
| Housing concept | |
| Terrasskvarteren – Selvaag | The housing concept is aimed at people of different ages and life situations to reduce loneliness, increase safety and social networks. Communal areas, varied apartments, a staffed reception and a shared ground floor for social activities and spontaneous everyday encounters are planned. The communal spaces include, among other things, overnight rooms for guests, gym, workshop and hobby and play rooms, a mini cinema, meeting rooms for work or homework, and a library/newspaper room. |
| Gasklocka 4 – Obos | Through OBOS Deläga, more people are given the opportunity to buy their home by acquiring only half of the apartment and gradually increasing the ownership share. |
| Other housing that opens up for people with disabilities | |
| Norra 2 – Stockholmshem | Stockholmshem has integrated seven service apartments for people with support needs. This helps counteract institutional housing forms and ensures that supported housing becomes a natural and self-evident part of the housing structure. |
| Gasklocka 4 – Obos | 12+1 LSS dwellings are planned (12 residential units plus one staff), which strengthens opportunities for equal and independent living for people with functional impairments. Besqab is planning six LSS dwellings for people with functional impairments. |
| Ängsbotten – Besqab | Besqab is planning six LSS apartments for people with disabilities. |
Accessibility and proximity
Bicycle and car parking spaces on private plots
Norra 2, Brofästet, Jackproppen
Requirements – parking
Bicycle spaces:
2.2-2.5/dwelling
Car spaces:
0.5/dwelling
Table 2.1 Car and bicycle spaces per dwelling, Norra 1 and Västra
| Property developer | Bicycle spaces/dwelling | Share of bicycle spaces indoors, % | Car spaces/dwelling | Share with charging, % |
|---|---|---|---|---|
| Norra 1 | ||||
| Erik Wallin | 0.9 | N/A | 0.5 | 0 |
| Familjebostäder | 1.8 | N/A | 0.5 | 0 |
| Järntorget | 2.0 | N/A | 0.7 | 0 |
| Lennart Ericsson | 2.2 | N/A | 0.7 | 0 |
| NCC | 1.5 | N/A | 0.5 | 5 |
| Reinhold Gustafsson | 1.0 | N/A | 0.5 | 0 |
| SBC Bo | 1.8 | N/A | 0.6 | 15 |
| Seniorgården | 2.2 | N/A | 0.6 | 13 |
| Svenska Hus | 2.2 | N/A | 0.5 | 25 |
| Viktor Hanson | 2.2 | N/A | 0.6 | 0 |
| Västra | ||||
| Borätt | 2.4 | N/A | 0.6 | 13 |
| ByggVesta | 1.9 | N/A | 0.3 | 0 |
| Einar Mattsson | 2.0 | N/A | 0.5 | 0 |
| HSB | 2.0 | N/A | 0.6 | 15 |
| JM, Tresticklan | 2.2 | N/A | 0.6 | 16 |
| JM, Tyresta | 2.0 | N/A | 0.5 | 12 |
| Järntorget | 2.2 | N/A | 0.5 | 0 |
| Primula | 1.1 | N/A | 0.5 | 0 |
| SKB | 2.2 | N/A | 0.5 | 8 |
| Stockholmshem | 2.0 | N/A | 0.5 | 12 |
| Svenska Bostäder, Björnlandet | 2.3 | N/A | 0.5 | 1 |
| Svenska Bostäder, Söderåsen | 1.8 | N/A | 0.1 | 0 |
Table 2.2 Car and bicycle spaces per dwelling, Norra 2, Brofästet and Jackproppen
| Property developer | Bicycle spaces/dwelling | Share of bicycle spaces indoors, % | Car spaces/dwelling | Share with charging, % |
|---|---|---|---|---|
| Norra 2 | ||||
| Amasten | 2.5 | 100 | 0.2 | 9 |
| Bonava | 2.4 | 100 | 0.6 | 26 |
| Erik Wallin | 2.2 | 50 | 1.0 | 44 |
| HEBA | 2.2 | 75 | 0.5 | 11 |
| Skanska | 2.5 | 76 | 0.5 | 10 |
| Stockholmshem | 2.4 | 79 | 0.5 | 11 |
| Viktor Hanson | 2.5 | 46 | 0.7 | 15 |
| Wallenstam, housing | 2.2 | 100 | 0.4 | 12 |
| Brofästet | ||||
| Besqab | 2.7 | 70 | 0.5 | 21 |
| Einar Mattsson, Backåkra 2 | 2.6 | 69 | 0.5 | 23 |
| Einar Mattsson, Koppången 2 | 2.3 | 84 | 0.5 | 20 |
| HSB | 2.8 | 73 | 0.5 | 26 |
| Norrterna | 2.6 | 49 | 0.5 | 22 |
| Riksbyggen | 2.6 | 88 | 0.5 | 60 |
| Stockholmshem | 3.4 | 82 | 0.5 | 18 |
| Tobin Properties | 2.6 | 59 | 0.5 | 24 |
| Åke Sundvall | 4.0 | 50 | 1.0 | 100 |
| Jackproppen | ||||
| Erik Wallin | 2.7 | 91 | 0.8 | 24 |
Norra 2
Bonava, Stockholmshem, Wallenstam and Skanska have bicycle parking spaces on tiered racks in bicycle rooms.
Amasten has fewer car parking spaces. The reason is that there is access to a car-sharing vehicle and more bicycle parking spaces than the requirement specifies.
Erik Wallin has been granted approval for one car space per townhouse.
In the evaluation of Norra 2, it was noted that the quantitative requirements for the number of bicycle parking spaces needed to be supplemented with qualitative requirements to ensure high functionality and user-friendliness.
Brofästet
As of Brofästet, the requirements have been tightened and expanded. The requirements include, among other things, a well-considered distribution of bicycle parking in different locations, special places for space-demanding bicycles, easily accessible bicycle rooms without height differences, and wide doors to bicycle rooms with automatic door openers.
- Einar Matsson does not meet the requirement for an even distribution between indoor and outdoor bicycle spaces.
- HSB, Riksbyggen, Stockholmshem and Tobin Properties have bicycle parking spaces on two-tiered racks in bicycle rooms.
- Stockholmshem also offers bicycle parking spaces on balconies, either by hanging or placing the bicycle on a stand.
- Åke Sundvall has built townhouses and has been approved for one car parking space per house. In addition, a high parking ratio is applied for bicycles.
In addition, there is a workshop area, air pump, charging facilities and lockable bicycle parking spaces both indoors and outdoors in the area.
Jackproppen
- The Real Estate Office's park playground on public land has six bicycle spaces.
Table 2.3 Bicycle spaces for premises in Gasverket, private land
| Property developer | Required minimum number of bicycle spaces | Completed spaces |
|---|---|---|
| Gasverket västra (existing) | ||
| CA Fastigheter, Building 7 | 5 | 0 |
| CA Fastigheter, Building 8 | 12 | 0 |
| CA Fastigheter, Building 10 | 37 | 0 |
| CA Fastigheter, Buildings 14 & 20 | 30 | 20 |
| CA Fastigheter, Building 27 | 3 | 0 |
| Development Office - Gasklocka 2 | 3 | 2 |
| Region Stockholm - Building 9 | 6 | 3 |
| Gasverket västra (new) | ||
| Real Estate Office - Hjorthagshallen & Vectura - Förskolan Anna | 23 | 56 |
| SISAB - Bobergsskolan | 250 | 130 |
Bicycle parking in Gasverket västra. Förskolan Anna and Hjorthagshallen share bicycle parking on private land, enabling efficient use across the day. Buildings 14 and 20 also share bicycle spaces for employees in both offices and retail.
None of the property developers meet the minimum requirements for the number of bicycle parking spaces, with the exception of the Real Estate Office (Hjorthagshallen) and Vectura (Förskolan Anna). Additional needs for bicycle spaces on private land will be met by CA Fastigheter in a garage in Gasverket östra. In addition to bicycle spaces on private land, there are also 246 bicycle parking spaces for visitors on public land.
Car parking in Gasverket västra. Gasverket västra consists largely of existing buildings with cultural heritage value, which means limited areas within the properties and a lack of underground garages. The need for car parking spaces will be solved by CA Fastigheter through a garage in Gasverket östra.
Södra Värtan norra, Gasklocka 4, etc.
Requirements – parking
Bicycle spaces office:
At least 15 spaces/1,000 m² GFA
Bicycle spaces retail:
At least 25 spaces/1,000 m² GFA
Car spaces office:
0-4 spaces/1,000 m² GFA
Car spaces retail:
0-6 spaces/1,000 m² GFA
Mobility index:
At least 65%
Table 2.4 Car and bicycle spaces, Södra Värtan norra
| Property developer | Bicycle spaces/employee | Share of bicycle spaces indoors, % | Bicycle spaces/1,000 m² GFA | Car spaces/1,000 m² GFA | Share with charging, % | Mobility index, % |
|---|---|---|---|---|---|---|
| Södra Värtan norra | ||||||
| Bonnier Fastigheter, Pirhuset | 0.2 | 100 | 15.0 | 3.2 | 100 | 84 |
| Bonnier Fastigheter, Portalen | 0.3 | 78 | 23.0 | 0.7 | 100 | 74 |
| Niam, Hangö | 0.2 | 98 | 22.6 | 2.7 | 100 | 68 |
| Niam, Neapel | 0.1 | 100 | – | 1.9 | 20 | – |
Table 2.5: Car and bicycle spaces, Gasklocka 4 and Terrasskvarteren
| Property developer | Required bicycle spaces/100 m² GFA | Bicycle spaces/100 m² GFA | Share of bicycle spaces indoors, % | Car spaces/dwelling | Share with charging, % | Mobility index, % |
|---|---|---|---|---|---|---|
| Gasklocka 4 | ||||||
| Obos | 2.8 | 3.0 | 57 | 0.3 | 100 | 78 |
| Terrasskvarteren | ||||||
| Obos | 3.0 | 3.1 | N/A | 0.5 | 100 | 65 |
| Selvaag | 3.1 | 3.2 | 100 | 0.5 | 100 | 86 |
The mobility index contributes to increased engagement with mobility solutions. The ability to choose between different measures appears to have strengthened the sense of responsibility among the property developers. This is also reflected in the work to fulfil established requirements, for example regarding the number of bicycle parking spaces. The monitoring shows more thorough records and clearer, more structured documentation.
- Niam (Neapel) has provided a clear description of goods reception and consolidation opportunities, which shows that the property developer has well-considered management of goods flows.
- Niam (Hangö) has a mobility plan that takes a holistic approach to mobility at an early stage.
- Bonnier (Portalen) has taken an overall grip on the mobility issue and produced a mobility plan for the project.
Construction logistics
Requirements – construction logistics
Consolidation:
At least 75%
Fill rate:
At least 50%
Table 2.6 Efficiency measurement for construction logistics
| 2025 | 2024 | 2023 | 2022 | 2021 | 2020 | 2019 | |
|---|---|---|---|---|---|---|---|
| Consolidation effect (%) | 81 | 76 | 71 | 48 | 60 | 80 | 77 |
| Fill rate for direct transports (%) | 49 | 46 | 76 | 52 | 73 | 77 | 28 |
Resource efficiency and reduced climate impact
Table 3.1 Amount of waste in pneumatic waste collection per fraction and year, kg/person
| 2025 | 2024 | 2023 | 2022 | 2021 | 2020 | 2019 | 2018 | 2017 | 2014 | |
|---|---|---|---|---|---|---|---|---|---|---|
| Newspapers | 5.6 | 5.6 | 5.6 | 5.8 | 6.4 | 5.6 | 10.1 | 13.7 | 10.8 | 37.3 |
| Plastic packaging | 5.9 | 7.0 | 5.8 | 5.6 | 6.6 | 5.9 | 7.0 | 8.5 | 7.2 | 10.2 |
| Residual waste | 93.5 | 86.2 | 88.1 | 91.4 | 104.3 | 98.6 | 79.9 | 93.4 | 89.8 | 157.2 |
Table 3.2 Distance to pneumatic waste collection per phase
| Property developer | Max distance, m |
|---|---|
| Brofästet | |
| Besqab | 30 |
| Einar Mattsson, Backåkra 2 | 39 |
| Einar Mattsson, Koppången 2 | 57 |
| HSB | 59 |
| Norrterna | 40 |
| Riksbyggen | 26 |
| Stockholmshem | 21 |
| Tobin Properties | 65 |
| Åke Sundvall | 25 |
| Terrasskvarteren | |
| Obos | 0 |
| Selvaag | 20 |
| Ängsbotten | |
| Besqab | 30 |
| NREP | 30 |
| Primula | 24 |
| Wallenstam | 28 |
| Gasverket östra | |
| Åke Sundvall, Building B1 | 5 |
| Åke Sundvall, Building B2 | 15 |
| Åke Sundvall, Building B3 | 15 |
| Gasklocka 4 | |
| Obos | 30 |
Table 3.3 Distance to waste room per phase, m
| Property developer | Max distance, m | Size, m²/dwelling |
|---|---|---|
| Brofästet | ||
| Besqab | 68 | 0.4 |
| Einar Mattsson, Backåkra 2 | 39 | 0.3 |
| Einar Mattsson, Koppången 2 | 82 | 0.5 |
| HSB | 50 | 2.0 |
| Norrterna | 59 | 0.4 |
| Riksbyggen | 27 | 0.4 |
| Stockholmshem | 17 | 0.4 |
| Tobin Properties | 55 | 0.6 |
| Åke Sundvall | 0 | 0 |
| Jackproppen (housing) | ||
| Erik Wallin | 12 | 0.3 |
| Gasklocka 4 | ||
| Obos | 0 | 0 |
| Terrasskvarteren | ||
| Obos | 0 | 0.2 |
| Selvaag | 20 | 0.3 |
| Gasverket östra | ||
| Åke Sundvall, Building B1 | 3 | 0.9 |
| Åke Sundvall, Building B2 | 47 | 0 |
| Åke Sundvall, Building B3 | 4 | 0 |
Table 3.4 Pop-up Reuse in Stockholm Royal Seaport
| 2025 | 2024 | 2023 | 2022 | 2021 | 2020 | 2019 | 2018 | 2017 | |
|---|---|---|---|---|---|---|---|---|---|
| Number of visitors | 7,150 | 7,620 | 7,400 | 8,630 | 4,130 | 1,760 | 12,880 | 2,970 | 2,970 |
| Reuse, tonnes | 4.8 | 2.0 | 3.1 | 5.4 | 2.6 | 1.5 | |||
| Collected bulky waste, tonnes | 15 | 3.2 | 3.2 | 2.9 | 2.6 | 1.9 | 2.1 |
Construction and demolition waste
Requirements – construction waste, property developers
Maximum amount of construction waste:
20 kg/m² GFA
Source separation:
100 weight% of construction waste shall be source-separated, of which 5 weight% may be landfilled
Summary of construction waste, per phase
Table 3.5 Construction waste from property developers, per phase
| Phase | kg/m² GFA | Tonnes |
|---|---|---|
| Norra 1 | 39 | 3,137 |
| Västra | 35 | 4,361 |
| Norra 2 | 40 | 2,905 |
| Brofästet | 72 | 3,061 |
| Jackproppen (housing) | 41 | 323 |
| Jackproppen (premises) | 126 | 21 |
| Gasverket västra (new) | 75 | 973 |
| Gasverket västra (existing) | 63 | 1,056 |
Norra 1 and Västra
Table 3.6 Construction waste from property developers, Norra 1 and Västra
| Property developer | Construction waste, kg/m² GFA | Construction waste, tonnes | Share source-separated, % |
|---|---|---|---|
| Norra 1 | |||
| Erik Wallin | 31 | 143 | N/A |
| Familjebostäder | 49 | 615 | N/A |
| Järntorget | 29 | 154 | N/A |
| Lennart Ericsson | 34 | 128 | N/A |
| NCC | 49 | 611 | N/A |
| Reinhold Gustafsson | 37 | 170 | N/A |
| SBC Bo | 49 | 368 | N/A |
| Seniorgården | 32 | 286 | N/A |
| Svenska Hus | 30 | 506 | N/A |
| Viktor Hanson | 44 | 155 | N/A |
| Västra | |||
| Borätt | 26 | 267 | 100 |
| ByggVesta | 52 | 587 | 52 |
| Einar Mattsson | 36 | 254 | 87 |
| HSB | 25 | 199 | 95 |
| JM, Tresticklan | 23 | 189 | 92 |
| JM, Tyresta | 26 | 267 | 100 |
| Järntorget | 25 | 148 | N/A |
| Primula | 49 | 669 | 63 |
| SKB | 38 | 480 | 75 |
| Stockholmshem | 53 | 740 | 98 |
| Svenska Bostäder, Björnlandet | 28 | 608 | 98 |
| Svenska Bostäder, Söderåsen | 27 | 209 | 97 |
Norra 2, Brofästet, Jackproppen, Gasverket västra and Elektriciteten
Table 3.7 Construction waste Norra 2, Brofästet, Jackproppen, Gasverket västra and Elektriciteten
| Property developer | Construction waste, kg/m² GFA | Construction waste, tonnes | Share source-separated, % |
|---|---|---|---|
| Norra 2 | |||
| Amasten | 44 | 120 | 88 |
| Bonava | 38 | 326 | 79 |
| Erik Wallin | 45 | 204 | 71 |
| HEBA | 40 | 283 | 82 |
| Skanska | 40 | 491 | 82 |
| Stockholmshem | 37 | 874 | 77 |
| Viktor Hanson | 35 | 129 | 86 |
| Wallenstam, housing | 46 | 405 | 78 |
| Wallenstam, preschool | 81 | 72 | 78 |
| Brofästet | |||
| Besqab | 38 | 370 | 94 |
| HSB | 46 | 310 | 88 |
| Riksbyggen | 158 | 1,412 | 94 |
| Stockholmshem | 41 | 202 | 92 |
| Tobin Properties | 64 | 750 | 78 |
| Åke Sundvall | 32 | 17 | 100 |
| Jackproppen (housing) | |||
| Erik Wallin | 41 | 323 | 52 |
| Jackproppen (premises) | |||
| Real Estate Office, Park playground | 126 | 21 | N/A |
| Gasverket västra (new) | |||
| Real Estate Office, Hjorthagshallen | 60 | 188 | 81 |
| SISAB, Bobergsskolan extension | 75 | 662 | 88 |
| Vectura, Förskolan Anna extension | 127 | 123 | 100 |
| Gasverket västra (existing) | |||
| CA Fastigheter, Building 10 | 75 | 186 | 99 |
| CA Fastigheter, Building 14 | 89 | 129 | 99 |
| CA Fastigheter, Building 20 | 90 | 173 | 91 |
| CA Fastigheter, Building 27 | 134 | 125 | 94 |
| CA Fastigheter, Building 8 | 44 | 128 | 92 |
| Region Stockholm, Building 9 | 57 | 314 | 97 |
Norra 2
Amasten and Viktor Hanson have discarded plasterboard and fill materials due to water damage.
Viktor Hanson has, despite two extensive water damage incidents in the project, managed to keep the amount of construction waste down by setting a goal to minimise construction waste at an early stage.
Wallenstam's preschool has had problems with external waste being placed in the waste containers.
Wallenstam's preschool and Erik Wallin have not actively worked on the issue.
Stockholmshem planned to minimise construction waste, but problems in construction production led to large amounts of concrete being discarded. Another factor was that external waste had been placed in the waste containers.
Skanska/HEBA believe that high staff turnover in the projects, among other things, has meant that the waste issue has been deprioritised.
Brofästet
- Besqab has worked with on-site inspections of waste containers and information campaigns to increase the sorting of construction waste. However, site-built external walls and brick waste have contributed to increased waste volumes.
- For Einar Mattsson 1, construction waste from the shared garage with Tobin Properties and Stockholmshem is included. Moisture penetration during the construction phase required remediation and resulted in increased waste volumes.
- For 16 weeks, Einar Mattsson 2 lacked access to pneumatic waste collection and a waste room for residents, which meant that household waste was sorted as mixed construction waste.
- HSB has had a shared waste facility together with another property developer, which has affected the reliability of waste reporting.
- Riksbyggen reports large amounts of concrete waste after balconies had to be demolished due to construction defects.
- Stockholmshem has worked actively with waste sorting through improved delivery planning, good sorting conditions on the construction site and information to employees about applicable requirements. However, reporting has in some cases been inaccurate.
- Tobin Properties built a cast-in-place structure, which resulted in increased concrete waste. Incorrectly cast basement walls had to be cut or recast, and additional drilling was required, which increased waste volumes.
- Norrterna has, despite repeated reminders, not reported any statistics.
Of the total amount of construction waste, 37% goes to energy recovery, mainly because of the high share of wood and other combustible material. Additionally, 19% is classified as material recycling and 27% as mineral masses for reuse. Due to inadequate sorting or lack of space, 14% has been classified as mixed waste. Only 2.5% by weight per cent goes to landfill.
Gasverket västra
Most properties in Gasverket västra are buildings of cultural heritage value. Only SISAB's Bobergsskolan and the Real Estate Office's Hjorthagshallen are new builds.
- CA Fastigheter (Building 8, Berghs), (Building 9, Spårvägsmuseet) and (Building 10, Sandvik) report high waste volumes without further explanation.
- CA Fastigheter (Building 14) reports high waste volumes, but 100% has been source-separated and no waste has gone to landfill.
- CA Fastigheter (Building 20, Systembolaget): 41% of the waste consists of demolition waste.
- Real Estate Office (Hjorthagshallen): The waste consists largely of mineral masses, mainly brick waste from facade work.
- Klätterverket (Building 7) has not reported any waste volumes.
- SISAB (Bobergsskolan) comprises both new construction and demolition. Due to lack of space, the construction waste was not fully separated. Construction defects meant that concrete had to be chipped away before repair.
- Vectura (Building 11, preschool): The waste consists mainly of demolition waste from the existing building.
In Gasverket västra, the share of reused material amounts to 26%, which is explained by a high share of mineral masses. 44% goes to energy recovery and 19% to material recycling. As a result of inadequate sorting or lack of space, 9% has been classified as mixed waste.
Requirements – construction waste, city's contracts
Construction waste:
100 weight% of construction waste shall be source-separated
Landfill:
Construction waste going to landfill shall be minimised
Table 3.8 Construction waste from contracts, public land, tonnes
| 2025 | 2024 | 2023 | 2022 | 2021 | 2020 | 2019 | 2018 | |
|---|---|---|---|---|---|---|---|---|
| Scrap and metal | 316 | 325 | 414 | 123 | 349 | 49 | 68 | 5 |
| Wood | 99 | 108 | 72 | 68 | 93 | 45 | 29 | 0 |
| Concrete and mineral masses | 1 | 46 | 53 | 28 | 86 | 2 | 58 | 0 |
| Combustible | 16 | 27 | 39 | 36 | 80 | 34 | 103 | 2 |
| Log mats and impregnated wood | 9 | 38 | 31 | 18 | 39 | 3 | 0 | 0 |
| Mixed waste | 8 | 24 | 22 | 9 | 16 | 23 | 36 | 0 |
| Stumps, branches and twigs | 0 | 0 | 8 | 3 | 14 | 1 | 66 | 0 |
| Drill cuttings, grinding water and sewage sludge | 97 | 0 | 21 | 0 | 11 | 4 | 36 | 0 |
| Hazardous waste | 99 | 9 | 37 | 6 | 30 | 5 | 42 | 0 |
| Other | 24 | 42 | 39 | 16 | 27 | 23 | 36 | 0 |
Combustible waste includes stumps, branches and twigs, as well as other combustible waste. Hazardous waste includes: electrical waste, batteries, home appliances, oil residues and sludge, chemicals, drill cuttings and grinding water etc. Other includes: asphalt, sewage water, mixed waste, landfill, plasterboard, mineral wool, plastic, corrugated cardboard and office waste.
Table 3.9 Demolition waste from contracts, public land, tonnes
| 2025 | 2024 | 2023 | |
|---|---|---|---|
| Asphalt | 3,903 | 3,647 | 592 |
| Concrete | 953 | 1,244 | 221 |
| Impregnated wood | 0 | 40 | 0 |
| Other | 9 | 7 | 12 |
In 2023, an old building in Värtahamnen was demolished, as it was in such poor condition that renovation was not possible. In 2024, significant demolition work was carried out in building 22 in Kolkajen due to extensive contamination. The structural frame and facade are being preserved, while large parts of the inner walls and foundations have been demolished. In 2025, the last parts of building 19, Gasverket, were demolished, which resulted in a significant amount of concrete waste; Tullhuset was also demolished. Of the total concrete waste from buildings, building 19 accounted for 65%.
Table 3.10 Demolition waste from buildings, city land, tonnes
| 2025 | 2024 | 2023 | |
|---|---|---|---|
| Contract | E-377 – Demolition of building 19, E-374 – Demolition of Tullhuset (2025) | E-390 – Demolition of crew building (2024) | E-377 – Demolition in building 22 (2023) |
| Brick | 0 | 805 | 119 |
| Scrap and metal | 12 | 11 | 212 |
| Concrete and mineral masses | 1,229 | 96 | 196 |
| Blue concrete | 51 | 96 | 0 |
| Combustible | 3 | 27 | 1 |
| Hazardous waste | 21 | 23 | 12 |
| Other | 45 | 128 | 127 |
Reuse
Table 3.11 Building materials and reuse, public land and buildings
| Year | Dismantled for reuse | Reused in Stockholm Royal Seaport |
|---|---|---|
| 2025 | Concrete blocks (92.24 tonnes) were dismantled from one of the gasholders and went to reuse, partly to the Construction Consolidation Centre. In the final landscaping of Hangövägen, 70 m² of concrete slabs were dismantled and will be reinstalled in the contract next year. During the demolition of the old passenger walkways in Värtahamnen, two spiral staircases (each 0.2 tonnes of concrete) and a few emergency exit signs were dismantled, all of which went to the contractor, as there was no further use for them. | A bundle of reused timber with 45×145 studs was used in a tunnel contract in Ropsten. 31 threaded rods from another contract were built into Saltkajen in Värtahamnen. In the final landscaping of Hangövägen, four signs of type B3 (e.g. for pedestrian crossings) were dismantled and reinstalled. |
| 2024 | During the construction of stairs in Hjorthagsparken, 70 blocks were dismantled and delivered to the Construction Consolidation Centre. Plants that were lifted from Bobergsgatan were replanted in other places in Stockholm (Kungsholmen and Finlandsparken). | In one of the gasholders, 2.7 tonnes of timber studs were used as formwork for concrete casting. |
| 2023 | A reuse centre opened at the Construction Consolidation Centre, where property developers’ leftover and surplus materials, such as insulation, doors, windows and timber, can be collected for use in new projects. During its first year of operation, the centre received 120 items, most of which were suitable for use in the final landscaping phase. At one of the gasholders, 35 tonnes of concrete waste were recovered and made into lego-style blocks by the supplier. Reused formwork was used to cast a concrete tunnel portal. The timber formwork was dismantled after the casting work so that it could be reused in future projects. | In the foundation work for future new passenger walkways at the Värtaterminalen, reused lighting foundations and paving slabs (7.6 tonnes) were used. At the new bridge for cyclists and pedestrians in Värtahamnen, 26 reused light fittings were built in and the entire bridge structure was reused from Slussen. In Saltkajen, 27.7 tonnes of steel sheet piling that had previously been at Slussen were used for, among other things, gangways. When casting the tunnel portal in concrete at Ropsten, large amounts of formwork were reused. In one of the gasholders, around a thousand bricks, ten large granite blocks and around a hundred granite stones, as well as parts of guide rails, were reused. |
Resources: Water and Sewer
Water use in production
Table 3.12 Water use in construction production, public land, m³
| 2025 | 2024 | 2023 | 2022 | |
|---|---|---|---|---|
| Total water consumption in production | 14,426 | 12,735 | 9,359 | 9,463 |
Resources: Energy
Energy use in buildings
Requirements – buildings' energy use
Norra 1, Västra, Norra 2, Brofästet and Gasverket:
Housing 55 kWh/m² and premises 45 kWh/m² purchased energy with electricity for heating and tap water weighted by a factor of 2 (specific energy use).
Later phases:
At least 35% lower compared with the current Swedish building regulation (BBR). The highest average heat transfer coefficient (Uₘ) shall be 0.30 W/m²K for multi-dwelling buildings without premises, 0.35 for multi-dwelling buildings with premises and 0.40 W/m²K for premises.
Existing buildings in Gasverket:
50% reduction compared with calculated energy performance before renovation.
Energy use is reported in kWh/m² Atemp per year and covers energy for heating, domestic hot water, property energy and comfort cooling. An allowance for ventilation in non-residential premises may be made in accordance with guidance issued by Boverket. Electricity for heating and hot water is weighted by 2.
Table 3.13 Energy performance Norra 1 and Västra, housing
| Property developer | Calculated values, kWh/m² | Metered PET, kWh/m² | Compared with BBR29 requirement, % | Type of heating |
|---|---|---|---|---|
| Norra 1 | ||||
| Erik Wallin | – | 46.0 | -39 | District heating and exhaust-air heat pump |
| Familjebostäder | – | 73.0 | -3 | District heating and exhaust-air heat pump |
| Järntorget | – | 75.0 | 0 | District heating and exhaust-air heat pump |
| Lennart Ericsson | – | 84.0 | 12 | District heating |
| NCC | – | 72.0 | -4 | District heating and exhaust-air heat pump |
| Reinhold Gustafsson | – | 98.0 | 31 | Ground-source heat pump |
| SBC Bo | – | 135.0 | 80 | District heating |
| Seniorgården | – | 86.0 | 15 | District heating and exhaust-air heat pump |
| Svenska Hus | – | 79.0 | 5 | District heating and exhaust-air heat pump |
| Viktor Hanson | – | 76.0 | 1 | District heating and exhaust-air heat pump |
| Västra | ||||
| Borätt | – | 55.0 | -27 | District heating |
| ByggVesta | – | 86.0 | 15 | District heating |
| Einar Mattsson | – | 79.0 | 5 | District heating and electricity (direct) |
| HSB | – | 65.0 | -13 | District heating |
| JM, Tresticklan | – | 53.0 | -29 | District heating |
| JM, Tyresta | – | 52.0 | -31 | District heating |
| Järntorget | – | 64.0 | -15 | District heating |
| Primula | – | 82.0 | 9 | District heating |
| SKB | – | 74.0 | -1 | District heating |
| Stockholmshem | – | 81.0 | 8 | District heating |
| Svenska Bostäder, Björnlandet | – | 60.0 | -20 | District heating |
| Svenska Bostäder, Söderåsen | – | 66.0 | -12 | District heating |
Norra 1 has a metered specific energy use of 72 kWh/m² Atemp per year including weighting. The metered energy use calculated according to BBR29 is 82 kWh/m² Atemp per year, which is 9% above. The fact that the primary energy figure becomes higher than the earlier calculation model for specific energy use is because electricity is now weighted by a factor of 1.8, which means that electricity-using systems – especially heat pumps – have a significantly larger impact on the result.
All buildings are connected to district heating in combination with exhaust-air heat pumps, with the exception of Lennart Ericsson's and SBC's buildings, which use district heating and FTX ventilation. One property developer, Reinhold Gustavsson, also has local energy production via a ground heat system in which a borehole heat pump uses boreholes in the ground. During the summer months the bedrock is recharged with solar heat via hot-water loops placed under the sedum roof, which raises the temperature in the bedrock and improves the heat pump's efficiency over time.
In Västra the metered energy use according to BBR29 is 68 kWh/m² Atemp per year. This means that the area performs 9% better than today's requirements. Only HSB in this phase has reported local production of solar electricity equivalent to 2.5 kWh/m² Atemp per year.
Table 3.14 Energy performance Norra 2, Brofästet, Jackproppen, housing
| Property developer | Calculated values, kWh/m² | Metered PET, kWh/m² | Compared with BBR29 requirement, % | Type of heating |
|---|---|---|---|---|
| Norra 2 | ||||
| Bonava | 43.6 | 54.9 | -27 | District heating |
| Erik Wallin | 39.2 | 50.2 | -33 | District heating |
| HEBA | 40.8 | 46.9 | -38 | District heating |
| Skanska | 39.3 | 58.2 | -22 | District heating |
| Stockholmshem | 36.8 | 49.4 | -34 | District heating |
| Viktor Hanson | 36.5 | 48.0 | -36 | District heating |
| Wallenstam, housing | 36.5 | 58.1 | -22 | District heating |
| Brofästet | ||||
| Besqab | 49.7 | 53.1 | -29 | District heating |
| Einar Mattsson, Backåkra 2 | 41.5 | 87.5 | 17 | District heating |
| Einar Mattsson, Koppången 2 | 60.1 | 77.9 | 4 | District heating |
| HSB | 46.8 | 54.6 | -27 | District heating |
| Riksbyggen | 54.9 | 51.0 | -32 | Heat pump |
| Stockholmshem | 6.4 | 14.9 | -80 | Heat pump |
| Tobin Properties | 40.3 | 60.1 | -20 | Heat pump |
| Åke Sundvall | 44.7 | 45.9 | -39 | District heating |
| Jackproppen (housing) | ||||
| Erik Wallin | 51.0 | 69.7 | -7 | District heating |
Norra 2
The requirements on energy performance cover energy use for heating, domestic hot water and property energy. Stockholm Royal Seaport's way of calculating energy use is not comparable with how calculation are made according to BBR; rather electric heating shall be weighted by a factor of 2, locally produced solar energy shall be credited, and normalisation and normal-year correction shall be applied. According to BBR applicable at the time, there is no weighting of electric heating. Metered energy use for Norra 2 is on average 66 kWh/m² (calculated according to BBR 19 and 20 applicable at the time) and 67.2 kWh/m² according to Stockholm Royal Seaport's calculation method.
Brofästet
- Besqab, Brf Stockholm Esplanad: The buildings have optimal form factor. The follow-up has been compiled from several sources. In connection with the city's follow-up, a serious error in the electricity use statistics was discovered. It turned out that correct connection was missing, both for building electricity and solar electricity. Outstanding issues include electrical connection, solar electricity system performance and communication with property developer and grid owner.
- Einar Mattsson 1, Backåkra: GeoFTX is used for preheating the supply air and works well. However, electrically connected comfort underfloor heating was not included in the design calculations, which contributes to the metered values exceeding the calculated ones. Already at the first follow-up meeting several faults and deficiencies were identified and have not yet been remedied. This has resulted in high energy use, where both heating and building electricity are close to double compared with designed levels. Solar electricity production could not be metered separately. According to information, overheating occurs in the apartments. The wastewater heat exchanger is judged to function as forecast.
- Einar Mattsson 2, Koppången: The building is equipped with district heating, FTX ventilation, wastewater heat exchanger and solar PVs. Electricity use is high, both regarding building electricity and comfort underfloor heating, electric heating batteries and heat pump – items not fully taken into account in the original calculation. Measurement of electricity use and solar PV production needs to be reviewed to enable correct follow-up and optimisation.
- HSB, Brf Broparken: The tenant-owner association's board has carried out exemplary work with energy monitoring and measures. Hot water use is low. At handover, several deficiencies were identified, which have been remedied. This has resulted in an improved energy performance of about 20%.
- Riksbyggen: Comfort underfloor heating is installed but lacks separate measurement, which is why standard values are used. The solar PV installation performs slightly better than calculated, which contributes to good overall energy performance.
- Stockholmshem: The buildings are plus-energy houses with optimal form factor and integrated technical systems – ground-source heat pump, FTX, wastewater heat exchanger and solar PVs. Distribution losses have been minimised and excess heat from the solar PVs' inverters recharges the boreholes, which optimises the ground-source heat pumps for tap water production in summer. The project stands out due to energy coordination from design to operation. Careful follow-up from day one has enabled rapid identification and remedy of deviations, which has gradually improved energy performance. The project has achieved plus-house standard on a net annual basis, without connection to district heating. The biggest challenge has been the offsetting of the energy well, which worsened the conditions for the ground-source heat pump. Solar electricity production amounted to 22.9 kWh/m², of which self-consumption is 7.3 kWh/m².
- Tobin Properties, Brf Äril: GeoFTX preheats the supply air in winter and cools in summer. The heat pumps' efficiency is lower than declared. The metered values are somewhat higher than calculated and solar PV production somewhat lower than expected.
- Åke Sundvall, Backåkra 5 and 6: The property consists of two townhouses. Energy requirements for single-family houses are applied. At the first follow-up, separate meters were missing, which has now been remedied. The residents have participated in information seminars to increase knowledge about energy use.
- Norrterna has, despite repeated reminders, not reported designed or metered energy values.
Jackproppen
Erik Wallin: Despite several years of challenges with energy improvement measures, Erik Wallin's buildings show a gradual improvement, with a 21% better energy performance than the previous year.
Housing, designed, other detailed plans
Table 3.15: Energy performance Gasklocka 4, Terrasshusen, Gasverket östra, housing
| Property developer | Calculated values, kWh/m² | Metered PET, kWh/m² | Compared with BBR29 requirement, % | Type of heating |
|---|---|---|---|---|
| Gasklocka 4 | ||||
| Obos | 60.0 | Not completed | -20 | District heating |
| Terrasskvarteren | ||||
| Obos | 48.3 | Not completed | -36 | District heating |
| Selvaag | 52.4 | Not completed | -30 | District heating |
| Gasverket östra | ||||
| Åke Sundvall, Building B1 | 42.0 | Not completed | -44 | District heating |
| Åke Sundvall, Building B2 | 42.2 | Not completed | -44 | District heating |
| Åke Sundvall, Building B3 | 42.0 | Not completed | -44 | District heating |
- Obos, Gasklocka 4/Stadsljus: The building includes housing as well as a restaurant, gym and preschool. Heating is planned by district heating in combination with heat recovery from wastewater using a heat pump. Further work is needed to reduce the primary energy figure as well as building’s average thermal transmittance (Uₘ).
- Selvaag, Terrasskvarteren: Heating is planned with district heating in combination with heat recovery from wastewater.
- Obos, Terrasskvarteren: The building consists of two interconnected blocks with housing and premises. Heating is planned with district heating in combination with heat recovery from wastewater. The calculated primary energy figure is achieved with a safety margin of 36%.
- Åke Sundvall, Gasverket östra: The buildings will be heated with district heating and provided with FTX ventilation.
Premises
Table 3.16: Energy performance Norra 2, Värtapiren, Jackproppen, Gasverket västra (new), Södra Värtan norra, Starkströmmen, premises
| Property developer | Calculated values, kWh/m² | Metered PET, kWh/m² | Compared with BBR29 requirement, % | Type of heating |
|---|---|---|---|---|
| Norra 2 | ||||
| Wallenstam, preschool | 57.1 | 72.6 | -18 | District heating |
| Värtapiren | ||||
| Stockholms Hamnar | 64.4 | 79.4 | 13 | District heating and heat pump |
| Jackproppen (premises) | ||||
| Real Estate Office, Park playground | 30.3 | 89.2 | 27 | Heat pump |
| Gasverket västra (new) | ||||
| Real Estate Office, Hjorthagshallen | 54.7 | 50.6 | -28 | District heating |
| SISAB, Bobergsskolan extension | 40.9 | 34.8 | -65 | District heating |
| Vectura, Förskolan Anna extension | 51.5 | Not completed | -26 | Heat pump |
| Södra Värtan norra | ||||
| Bonnier Fastigheter, Pirhuset | 25.5 | Not completed | -64 | Ground-source heat pump with district heating peak |
| Bonnier Fastigheter, Portalen | 39.8 | Not completed | -43 | District heating |
| Niam, Hangö | 33.0 | Not completed | -53 | District heating |
| Starkströmmen | ||||
| Trafikverket | 54.6 | Not completed | -22 | District heating |
The metered values in Gasverket västra show that several of the existing buildings achieved or exceed the designed improvement. Measures include, among other things, additional insulation of roof, walls and floor, energy-efficient windows, improved airtightness, installation of FTX systems and district heating, in some cases district cooling and heat pump. Challenges occur in buildings with activities such as restaurant, bakery and museum, where it is difficult to separate operational energy from property energy. In some cases sub-meters are missing, which makes normalisation and analysis more difficult.
- CA Fastigheter, Building 8, Berghs: The energy performance is better than what is normally required for new production. An important explanation is the building's generous installation spaces, which has enabled energy-efficient system solutions with small distribution losses. Occupancy rate and well-functioning operation are also reasons that have contributed to the normal-year corrected energy use decreasing compared with the previous season.
- CA Fastigheter, Building 10, Sandvik: Despite large areas, significant volumes and technical challenges – such as high ventilation flows and extensive heating needs – the follow-up shows a good result. The open layout and large room volume require the property to be controlled toward a balanced level regarding temperature and ventilation. Occupancy rate is also cited as a factor that has positively influenced energy use.
- CA Fastigheter, Building 14. The building contains office, restaurant and bakery, which entails complex installation and metering systems. The relatively large window areas also affect the energy balance. Normalisation is particularly challenging because it is difficult to separate process energy from property energy. The absence of sub-meters for bakery and restaurant means that allocation and normal-year correction have been carried out using calculations.
- CA Fastigheter, Building 20, Systembolaget: The building does not have an optimal form factor.
- CA Fastigheter, Building 27. The building houses several activities, which makes energy follow-up complex. Hot water use is difficult to measure and separate between activities. Assessment, allocation and normalisation have therefore been carried out with the support of calculations.
- Region Stockholm, Building 9, Spårvägsmuseet: The building’s average thermal transmittance (Uₘ) is 0.62 W/m²K, which is close to BBR's requirement for new construction. The high requirements on indoor climate for museum operations entail complex technical systems, where it is difficult to separate operational energy from property energy. The new mezzanine floors that have been added during the renovation affect the ventilation flows and energy demand. The museum is also planning to introduce meteorological control of the property.
- Development Office, Gasklocka 2, stage, calculated: The heating system consists of district heating in combination with a ground-source heat pump as well as an efficient FTX system supplemented with free cooling. The good energy performance is achieved because a new building volume with a modern building envelope and energy-efficient installations has been built inside the existing building.
Gasverket västra, new buildings
Real Estate Office, Hjorthagshallen: The building is designed to passive house standard (FEBY) with an energy-efficient building envelope and demand-controlled ventilation. The building has an optimal form factor and is placed against bedrock, without large glass surfaces, which contributes to low heat loss. The Uₘ value is 0.2 W/m²K. However, in this type of activity it is difficult to clearly separate property energy from operational energy, which also makes normalisation of energy values difficult.
SISAB, Bobergsskolan, new and existing building: Solar PVs are installed on parts of the roof. The new part of the building shows good results in energy verification and meets the energy requirements with a good margin. The older part, on the other hand, uses more energy than calculated. SISAB is planning to further develop ventilation control, including increased demand control and CO₂ regulation, to improve the energy performance in the existing part.
Vectura, Building 11, preschool, new build and existing: A GeoFTX solution preheats outside air in winter and cools in summer.
Real Estate Office, park playground: A well-insulated park playground building has been built with ground-source heat pump, FTX ventilation and solar PVs on the roof. Metering and follow-up of energy items as well as normalisation need to be developed. Measures were carried out during winter 2024/25, which is why the effects are not yet fully reflected in the statistics. A defective main meter from Stockholm Exergi was identified, where sub-meters showed considerably lower consumption. Sub-metering has been an important tool in troubleshooting.
Södra Värtan norra
- Bonnier, Hangö. The buildings have a well-insulated building envelope and well-considered solar shading.
Table 3.17. Energy performance Gasverket västra (existing), premises
| Property developer | Reference value, kWh/m² | Calculated values, kWh/m² | Metered PET, kWh/m² | Change vs reference, % | Type of heating |
|---|---|---|---|---|---|
| Gasverket västra (existing) | |||||
| CA Fastigheter, Building 7 | 446 | 133.5 | 129.0 | -70 | District heating |
| CA Fastigheter, Building 8 | 336 | 131.4 | 56.6 | -80 | District heating |
| CA Fastigheter, Building 10 | 414 | 135.0 | 98.3 | -70 | District heating |
| CA Fastigheter, Building 14 | 388 | 138.3 | 128.1 | -64 | District heating |
| CA Fastigheter, Building 20 | 414 | 107.8 | 97.3 | -74 | District heating |
| CA Fastigheter, Building 27 | 410 | 122.8 | 115.8 | -73 | District heating |
| Region Stockholm, Building 9 | 344 | 74.6 | 71.4 | -68 | District heating |
| SISAB, Bobergsskolan existing | 214 | 84.2 | 71.4 | -63 | District heating |
| Vectura, Förskolan Anna existing | – | 91.0 | – | – | Heat pump |
Production of local solar energy on buildings
Requirements – local energy production
Solar electricity:
2 kWh/m² Atemp per year
Solar heat:
6 kWh/m² Atemp per year
Alternatively a combination of these two.
Table 3.18 Production of solar energy per phase and property developer, kWh/m2
| Property developer | Calculated, kWh/m² | Metered, kWh/m² |
|---|---|---|
| Norra 2 | ||
| Amasten | 1.2 | 4.0 |
| Bonava | 2.3 | 2.3 |
| Erik Wallin | 2.2 | 2.5 |
| HEBA | 2.2 | 2.3 |
| Skanska | 3.2 | 3.0 |
| Stockholmshem | 4.5 | 4.3 |
| Viktor Hanson | 3.0 | 2.5 |
| Wallenstam, housing | 0.0 | 0.0 |
| Wallenstam, preschool | 0.0 | 0.0 |
| Brofästet | ||
| Besqab | 2.0 | 1.8 |
| HSB | 2.1 | 2.4 |
| Norrterna | 2.2 | N/A |
| Riksbyggen | 2.0 | 2.5 |
| Stockholmshem | 18.1 | 22.9 |
| Tobin Properties | 2.4 | 1.8 |
| Åke Sundvall | 0.0 | N/A |
| Jackproppen (housing) | ||
| Erik Wallin | 3.7 | 4.1 |
| Värtapiren | ||
| Stockholms Hamnar | 3.4 | 3.2 |
| Jackproppen (premises) | ||
| Real Estate Office, Park playground | 5.0 | 8.0 |
| Gasverket västra (new) | ||
| Real Estate Office, Hjorthagshallen | 2.3 | 2.8 |
| SISAB, Bobergsskolan extension | 2.2 | 2.5 |
| Vectura, Förskolan Anna extension | 2.0 | N/A |
Brofästet
- Besqab, BRF Stockholm Esplanad, has had problems with electricity connection in general as well as metering. Measures are planned with Ellevio for metering.
- Einar Mattsson has not got their metering in order.
- Stockholmshem: The energy system is optimised to be able to use solar electricity maximally for own use. Own electricity use is assessed at 7.3 kWh/m².
- Tobin Properties has reported low production due to poor conditions.
- Riksbyggen has a production that each year shows better results than calculated.
- Åke Sundvall has, due to an unfavourable location, been given permission to place solar PVs in coming projects in Gasverket.
- Norrterna has not reported any figures so far.
In Gasverket västra no requirements were set on local production of renewable energy for existing buildings due to the high cultural heritage values. Requirements have been set on new construction.
- SISAB, Bobergsskolan: solar electricity produced on the new building covers both new and existing buildings.
Jackproppen, Real Estate Office park playground: The installation is large in relation to the heated area, which explains the high production.
Table 3.19 Production of solar energy, phase and property developer, designed buildings, kWh/m2
| Property developer | Calculated, kWh/m² | Metered |
|---|---|---|
| Gasklocka 4 | ||
| Obos | 2.1 | Not completed |
| Terrasskvarteren | ||
| Obos | 5.7 | Not completed |
| Selvaag | 5.8 | Not completed |
| Södra Värtan norra | ||
| Bonnier Fastigheter, Pirhuset | 3.9 | Not completed |
| Bonnier Fastigheter, Portalen | 2.1 | Not completed |
| Niam, Hangö | 2.2 | Not completed |
| Niam, Neapel | 2.0 | Not completed |
| Gasverket östra | ||
| Åke Sundvall, Building B1 | 8.6 | Not completed |
| Åke Sundvall, Building B2 | 7.8 | Not completed |
| Åke Sundvall, Building B3 | 7.8 | Not completed |
Construction site cabins, property developers
Requirements – construction site cabins
Office cabin:
4,000 kWh/year
Crew cabin:
7,000 kWh/year
Table 3.20 Energy use construction site cabins, Brofästet, Jackproppen and Gasverket västra, kWh/year
| Property developer | Office cabin, kWh/year | Crew cabin, kWh/year |
|---|---|---|
| Brofästet | ||
| Besqab | 6 055 | 6 055 |
| Riksbyggen | 2 880 | 2 880 |
| Stockholmshem | 4 369 | 4 369 |
| Tobin Properties | 6 873 | 6 873 |
| Jackproppen | ||
| Erik Wallin | 4 000 | 4 000 |
| Gasverket västra (new) | ||
| Real Estate Office, Hjorthagshallen | 3 327 | 7 983 |
| SISAB, Bobergsskolan extension | 2 244 | 3 468 |
| Vectura, Förskolan Anna extension | 6 386 | 5 615 |
Besqab and Tobin Properties have not provided any explanation for the high energy use. Besqab has, however, installed a heat pump to reduce energy demand.
CA Fastigheter, Buildings 8, 10, 14, 20 and 27, have a shared electrical supply for several buildings. Building 14 has been used as both office and crew cabin, which means that energy use per building cannot be separated.
The Real Estate Office's park playground has not provided an explanation for the high energy use.
Region Stockholm, Building 9, Spårvägsmuseet, and Klätterverket, Building 8, have not submitted data.
Einar Mattson, HSB, Norrterna and Åke Sundvall have not submitted data.
Energy use, public land
Pneumatic waste collection
Requirements – pneumatic waste collection facility
Plastic:
At most 300 kWh/tonne
Newspapers:
At most 110 kWh/tonne
Residual waste:
At most 95 kWh/tonne
Table 3.21 Energy use of pneumatic waste collection facility per fraction, kWh/tonne
| 2025 | 2024 | 2023 | 2022 | 2021 | 2020 | 2019 | 2018 | 2017 | |
|---|---|---|---|---|---|---|---|---|---|
| Newspapers | 251 | 227 | 243 | 602 | 276 | 347 | 272 | 249 | 250 |
| Plastic packaging | 239 | 198 | 250 | 387 | 325 | 329 | 453 | 349 | 401 |
| Residual waste | 118 | 76 | 91 | 149 | 92 | 100 | 179 | 140 | 113 |
Lighting
Requirements – street lighting
Central squares:
0.8 kW/m²
Standard streets (up to 8 m wide):
1.6 kW/km
Side streets and park paths:
1.4 kW/km
Table 3.22 Energy use street lighting in Hjorthagen, kWh
| 2025 | 2024 | 2023 | 2022 | 2021 | |
|---|---|---|---|---|---|
| Total energy use | 171,500 | 170,200 | 173,900 | 174,900 | 171,000 |
Local production of solar energy, Construction and Mass Consolidation Centres
Table 3.23 Solar electricity production, city's facilities, kWh
| 2025 | 2024 | 2023 | 2022 | 2021 | 2020 | 2019 | |
|---|---|---|---|---|---|---|---|
| Solar electricity Mass Consolidation Centre | 282,000 | 204,100 | 234,700 | 255,400 | 239,800 | 243,400 | 247,800 |
| Solar electricity Construction Consolidation Centre | 30,900 | 32,200 | 36,800 | 40,000 | – | – | – |
Energy use public land
Table 3.24 Energy use per contract, kWh, 2025
| E-422 Bobergsgatan | E-377 Soil remediation Kolkajen | E-334 Gasverksvägen | E-378 Tunnel driving Ropsten | E-374 Saltkajen | E-410 Final landscaping Hangövägen | E-426 Demolition of passenger walkways | |
|---|---|---|---|---|---|---|---|
| Fuel consumption | 295,900 | 1,821,200 | 29,200 | 2,916,000 | 486,700 | 420,500 | 19,600 |
| Fuel consumption (renewable) | 293,395 | 1,722,127 | 28,356 | 0 | 485,085 | 420,273 | 19,635 |
| – Of which electricity | 0 | 0 | 0 | 0 | 0 | 26,748 | 3,240 |
| Other electricity use | 19,600 | 58,700 | 0 | 1,200 | 1,554,600 | 10,200 | 400 |
| Total | 315,500 | 1,879,900 | 29,200 | 2,917,200 | 2,041,300 | 430,700 | 20,000 |
Climate
Climate impact public land
Requirements – the city's work
Climate calculation:
Climate calculation and action plan at each stage, limit values for prioritised materials.
Material:
Requirements on prioritised material groups such as concrete and steel.
Table 3.25 Measures taken to reduce climate impact, Södra Värtan
| Contract | Execution | Material requirements | Fuel requirements | Total reduction |
|---|---|---|---|---|
| E-374 Saltkajen | 1,257 | 793 | 275 | 2,200 |
| E-410 Final landscaping | 226 | 26 | 252 | |
| E-503 Commuter boat jetty | 152 | 152 | ||
| Total | 2,604 |
Table 3.26 Climate impact from construction, public land, per phase
| Norra 1 | Västra | Norra 2 | Brofästet | Södra Värtan | Ängsbotten | |
|---|---|---|---|---|---|---|
| Status | Completed | Completed | Completed | Completed | Partially completed | Programme document |
| Total climate impact, tonnes CO₂e | 7,590 | 24,860 | 2,420 | 110 | 31,000 | 12,850 |
| Public land area, m² | 51,700 | 42,800 | 35,500 | 21,300 | 61,200 | 19,400 |
| Climate impact per m², kg CO₂e/m² | 147 | 581 | 68 | 5 | 507 | 662 |
| Share of cement-based products, % | 31 | 27 | 38 | 36 | 37 | 27 |
| Share of steel products, % | 64 | 70 | 48 | 29 | 49 | 60 |
| Share of mass handling, machinery & other, % | 5 | 5 | 12 | 35 | 10 | 11 |
Table 3.27 Climate calculations early stages
| Contract | Tonnes CO₂e (system document) | Tonnes CO₂e (construction document) | Planned measures |
|---|---|---|---|
| E-389 Rock excavation GK4 | 4 | 8 | Minimise the need to transport materials. |
| E-357 Park | 78 | 46 | Reuse materials, for example granite block steps. Reuse of fill. The staircase's construction, steel or wood, can be discussed. Surface for footpath ramp and other footpaths. |
| E-406 Klockparken | 451 | not investigated (−50 tonnes for concrete) | Optimisation of the concrete recipe, supplier of reinforcement, consider another method to reduce thermal cracks, e.g. cooling with cooling hoses. |
| E-413 Gasverksvägen | 312 | 267 |
Fossil-free construction site
Requirements – fossil-free construction site
Renewable electricity:
100% of electricity use shall be eco-labelled
Fuel:
At least 20% of fuel for vehicles and machinery shall be renewable (from 2025: 100%)
Table 3.28 Climate impact of fuel use, public land, 2025
| Fuel type | Litres | kWh | Tonnes CO₂e | Equivalent tonnes CO₂e if only fossil fuels had been used |
|---|---|---|---|---|
| Diesel | 14,897 | 48 | 1,418 | |
| Petrol | 445 | 1 | 16 | |
| Alkylate petrol | 349 | 1 | 1 | |
| HVO 100 | 425,583 | 213 | ||
| RME | 5,258 | 4 | ||
| Electricity | 32,780 | 1 | ||
| Total | 268 | 1,435 |
Carbon sinks
Table 3.29 Newly planted trees and biochar's contribution to carbon sinks
| Norra 1 | Västra | Norra 2 | Brofästet | Jackproppen | Gasverket västra | Gasverket östra | Södra Värtan, norra | |
|---|---|---|---|---|---|---|---|---|
| Newly planted trees, no. | 118 | 209 | 120 | 116 | 65 | 12 | 14 | 0 |
| Carbon sink, tonnes CO₂e/year | -2.4 | -4.2 | -2.4 | -2.39 | -1.3 | -0.2 | -0.3 | 0 |
| Biochar, m³ | 0 | 820 | 700 | 240 | 40 | 0 | 45 | 25 |
| Carbon sink (biochar), tonnes CO₂e | 0 | -410 | -350 | -4,620 | -20 | 0 | -27 | -15.4 |
Climate impact buildings
Requirements – climate impact buildings
Earlier phases:
Climate calculation.
Södra Värtan norra:
No requirements on limit value.
Gasklocka 4 / Stadsljus and Terrasshusen:
< 300 kg CO₂e/m²From land allocation 2025:
250 kg CO₂e/m² – target by 2030: 180 kg CO₂e/m²
Covers A1-A5 and building parts 2-8 according to the Swedish Construction Federation's building parts table. For building parts 7-8, default values may be used if these have not been calculated. Calculation in design is based on generic data, while as-built documents – as far as possible – shall be based on EPDs.
Table 3.30 Climate impact buildings
| Property developer | Scope | Climate impact, kg CO₂e/m² GFA | Total climate impact, tonnes CO₂e | Stage |
|---|---|---|---|---|
| Gasklocka 4 | ||||
| Obos | Building parts 2-8 | 461 | 20,505 | Construction document |
| Terrasskvarteren | ||||
| Obos | Building parts 2-8 | 288 | 2,255 | System document |
| Selvaag | Building parts 2-8 | 352 | 5,787 | Construction document |
| Södra Värtan norra | ||||
| Bonnier Fastigheter - Pirhuset | Building parts 2-8 | 393 | 21,943 | Construction document |
| Bonnier Fastigheter - Portalen | Building parts 2-8 | 352 | 6,166 | System document |
| Niam - Hangö | Foundation, structural frame, etc. | 243 | 2,358 | System document |
| Niam - Neapel | Foundation, structural frame, etc. | 256 | 12,983 | System document |
| Elektriciteten | ||||
| Ellevio | Substructure, structural frame | 228 | 964 | Construction document |
| Gasverket östra | ||||
| Åke Sundvall - Building B1 | Building parts 2-8 | 258 | 710 | Programme document |
| Åke Sundvall - Building B2 | Building parts 2-8 | 258 | 538 | Programme document |
| Åke Sundvall - Building B3 | Building parts 2-8 | 258 | 535 | Programme document |
Södra Värtan norra: Bonnier, Pirhuset phase 1. The building is planned to be certified according to NollCO₂, which means that climate impact must first be reduced and then balanced to reach net zero. A workshop was carried out to optimise the structural frame. Proposed measures included, among other things, reduced column spacing, thinner profiles and use of green steel. Further optimisations were made in basement external walls and through fewer piles and replacement of facade beams with laminated timber. The proximity to port operations requires heavy facade systems to handle low-frequency noise, which entails approximately 50 kg CO₂/m² higher climate impact. The alternative with air gaps was assessed to reduce the building's usable area.
Södra Värtan norra: Bonnier, Portalen. In the feasibility study stage, improvement potential was analysed before structural and foundation systems were designed. The focus was on optimising basement, structural frame, foundation and building envelope from a climate perspective. The proposals included minimised quantities of steel and concrete, planned drying times for climate-improved concrete, investigation of renewable structural materials, and evaluation of facade glass and reused brick. EPDs are used for key components such as load-bearing walls and columns.
Södra Värtan norra: Niam – Neapel. Two scenarios have been climate-calculated. To achieve 40% lower climate impact for foundation structures, load-bearing parts in the structural frame, climate-separating parts and complementary parts in external walls as well as inner space-defining building parts, primarily the use of recycled steel is proposed. EPDs are used for concrete and reinforcement.
Södra Värtan norra: Niam – Hangö. Climate impact has been calculated based on quantity data and generic values. Optimisations have mainly been made in the structural frame and facade through reduced quantities of hollow-core slabs, steel beams and reinforcement. In the system document stage two structural alternatives are being investigated, where alternative 2 gives 291 tonnes CO₂ lower emissions.
Terrasskvarteret, OBOS. The building shall be certified according to Svanen. A climate calculation over the entire life cycle A-D has been carried out. The city's requirement is a maximum of 300 kg CO₂/m² GFA. The first calculation shows that the requirement is met.
Terrasskvarteret, Selvaag Pluss. The city's requirement is a maximum of 300 kg CO₂/GFA. The project is based on a slab on ground with prefabricated half-sandwich elements and timber construction on the top floor. Climate-improved concrete is proposed.
Gasklocka 4 – Stadsljus, OBOS. The climate impact is so high, mainly due to large concrete volumes and a corten facade. The measures focus on comparisons of different external walls, floors and balconies as well as product-specific material choices. Climate-improved concrete provides the greatest reductions:
- Approximately 40% lower emissions for external walls.
- Approximately 56% lower emissions for internal walls.
If all walls are made of climate-improved concrete, emissions from load-bearing structures decrease by 78 kg CO₂/m² GFA. The study also shows the potential to reduce concrete volumes through thinner floors, varied wall thicknesses, optimised external wall geometry, hybrid solutions for balconies, and a better balance between concrete and reinforcement. On plan 08 and 09, a backfilled basement wall can be replaced with a reinforced rock wall.
Gasverket östra – Buildings B1-B3, Åke Sundvall. Åke Sundvall has its own targets of 246 kg CO₂/m² by 2025 and 169 kg CO₂/m² by 2030 for building parts 2-336. The project is built in timber modules with on-site brick facade on the outside. Climate calculations are used early on for system choices and material optimisation.
Elektriciteten – Ellevio. The calculation covered substructure and structural frame and increased from system document to construction document, mainly due to larger quantities of concrete and reinforcement than planned, since both foundation and floor slabs needed to be reinforced. Optimisation meetings raised, among other things, reduced over-dimensioning, optimised base-hall walls and climate-improved concrete. Cost was a guiding factor, and the lack of clear climate targets made optimisation work more difficult.
Climate impact from energy use, operation
The emission factor for electricity is calculated on Nordic electricity mix where a rolling five-year average is used for the emission factor.
Table 3.31 Climate impact energy use, buildings
| Energy used | Climate impact | |
|---|---|---|
| District heating | 17.7 GWh | – |
| Electricity | 17.0 GWh | – |
| Total | 1,740 tonnes CO₂e (5 kg CO₂e/m² Atemp) |
Table 3.32 Climate impact energy, public land and facilities
| Energy used, MWh | Climate impact, tonnes CO₂e | |
|---|---|---|
| Lighting | 172 | 7 |
| Pneumatic waste collection | 96 | 4 |
| Mass Consolidation Centre | 613 | 26 |
| Construction Consolidation Centre | 343 | 23 |
| Total | 806 | 60 |
Electrical infrastructure
Requirements – electrical infrastructure
Norra 2, Gasverket, Brofästet, Jackproppen:
At least 20%
Later phases:
At least 50%
Table 3.33 Share of charging spaces, phase
For details see also table 2.1 to table 2.4.
| Phase | Share of charging spaces, % |
|---|---|
| Norra 1 | 8 |
| Västra | 7 |
| Norra 2 | 15 |
| Brofästet | 26 |
| Jackproppen (housing) | 24 |
| Ängsbotten | 2 |
| Gasklocka 4 | 100 |
| Terrasskvarteren | 100 |
| Gasverket västra (new) | 100 |
| Gasverket västra (existing) | 100 |
| Gasverket östra | 100 |
| Starkströmmen | 45 |
| Södra Värtan norra | 78 |
Resources: materials
Soil remediation
Table 3.34 Use of chemicals, soil remediation, tonnes
| 2025 | 2024 | 2023 | 2022 | 2021 | |
|---|---|---|---|---|---|
| Persulphate | 59 | 309 | 600 | 700 | 1,190 |
| Lye (sodium hydroxide 25%) | 135 | 410 | 876 | 1,022 | 0 |
| Oxygen and nutrient supply | 29 | 15 | 0 | 0 | 0 |
| Activated carbon | 38 | 56 | 0 | 0 | 0 |
Mass handling
Includes external masses.
Table 3.35 Mass handling at the Mass Consolidation Centre, tonnes
| 2025 | 2024 | 2023 | 2022 | 2021 | 2020 | 2019 | |
|---|---|---|---|---|---|---|---|
| Masses in to Mass Consolidation Centre (total) | 41,500 | 485,300 | 530,000 | 320,900 | 84,700 | 75,100 | 38,800 |
| Of which clean masses (rock) | 2,550 | 431,600 | 501,200 | 263,800 | 9,400 | 26,800 | 10,200 |
| Of which excavated masses | 35,600 | 53,400 | 27,300 | 57,100 | 75,200 | 19,300 | 28,600 |
| Of which other fractions | 3,350 | 300 | 1,500 | 0 | 0 | 29,000 | 0 |
| Masses out from Mass Consolidation Centre (total) | 156,300 | 233,000 | 168,900 | 126,200 | 105,900 | 62,000 | 25,800 |
| Of which fill masses | 136,000 | 202,900 | 148,900 | 90,300 | 61,710 | 46,500 | 8,700 |
| Of which landfill masses | 16,800 | 29,300 | 18,800 | 35,900 | 44,200 | 15,500 | 17,100 |
| Of which other waste | 3,500 | 700 | 1,200 | 0 | 0 | 0 | 0 |
| Of which stock | 456,500 | 252,400 | 0 | 0 | 0 | 0 | 0 |
Cost analysis Mass Consolidation Centre
The local Mass Consolidation Centre has reduced costs for mass handling by at least 20%, mainly through shorter transport distances (about 2 km compared with 35 km) and reduced landfill costs. Without the Mass Consolidation Centre, the cost would amount to about SEK 500 per tonne. The saving is about SEK 100/tonne at 40% recycling rate and SEK 250/tonne at 80% recycling rate.
Material choices
Requirements – building materials
Content:
Products shall meet requirements on content and documentation corresponding to the content criteria in national assessment systems.
Documentation:
All products shall be documented in a digital logbook
Prohibited substances:
PVC, endocrine-disrupting substances and zinc and copper may not occur.
Indoor environment
Requirements – indoor environment
Miljöbyggnad Gold indoor environment
Miljöbyggnad Gold aggregated (weighted) from indicators in the indoor environment area covering acoustic environment, moisture safety, thermal climate summer and winter.
Table 3.36 Miljöbyggnad indoor environment, per property developer
| Property developer | Indoor environment rating |
|---|---|
| Norra 1 | |
| Erik Wallin | N/A |
| Familjebostäder | N/A |
| Järntorget | N/A |
| Lennart Ericsson | Silver |
| NCC | N/A |
| Reinhold Gustafsson | N/A |
| SBC Bo | N/A |
| Seniorgården | N/A |
| Svenska Hus | N/A |
| Viktor Hanson | N/A |
| Västra | |
| Borätt | N/A |
| ByggVesta | N/A |
| Einar Mattsson | Silver |
| HSB | Silver |
| JM, Tresticklan | N/A |
| JM, Tyresta | N/A |
| Järntorget | N/A |
| Primula | N/A |
| SKB | N/A |
| Stockholmshem | Silver |
| Svenska Bostäder, Björnlandet | Bronze |
| Svenska Bostäder, Söderåsen | N/A |
| Norra 2 | |
| Amasten | Silver |
| Bonava | Silver |
| Erik Wallin | Gold |
| HEBA | Gold |
| Skanska | Silver |
| Stockholmshem | Gold |
| Viktor Hanson | Gold |
| Wallenstam, housing | Gold |
| Wallenstam, preschool | Gold |
| Brofästet | |
| Besqab | Gold |
| Einar Mattsson, Backåkra 2 | Gold |
| Einar Mattsson, Koppången 2 | Gold |
| HSB | Silver |
| Norrterna | Gold |
| Riksbyggen | Gold |
| Stockholmshem | Gold |
| Tobin Properties | Gold |
| Åke Sundvall | Gold |
| Jackproppen (housing) | |
| Erik Wallin | Bronze |
| Gasklocka 4 | |
| Obos | Silver |
| Terrasskvarteren | |
| Obos | N/A |
| Selvaag | Gold |
| Värtapiren | |
| Stockholms Hamnar | Gold |
| Jackproppen (premises) | |
| Real Estate Office, Park playground | Gold |
| Gasverket västra (new) | |
| Real Estate Office, Hjorthagshallen | Gold |
| SISAB, Bobergsskolan extension | Gold |
| Vectura, Förskolan Anna extension | Gold |
| Gasverket västra (existing) | |
| CA Fastigheter, Gasklocka 1 | N/A |
| CA Fastigheter, Gasklocka 5 | Gold |
| CA Fastigheter, Building 10 | Silver |
| CA Fastigheter, Building 14 | Bronze |
| CA Fastigheter, Building 20 | Gold |
| CA Fastigheter, Building 27 | Gold |
| CA Fastigheter, Building 7 | Gold |
| CA Fastigheter, Building 8 | N/A |
| Development Office, Gasklocka 2 | Silver |
| Region Stockholm, Building 9 | Silver |
| Södra Värtan norra | |
| Bonnier Fastigheter, Pirhuset | Gold |
| Bonnier Fastigheter, Portalen | Gold |
| Niam, Hangö | Gold |
| Niam, Neapel | Gold |
| Starkströmmen | |
| Trafikverket | Gold |
| Gasverket östra | |
| CA Fastigheter, Building 19 | N/A |
| CA Fastigheter, Building 30 | N/A |
| CA Fastigheter, Building D | N/A |
| CA Fastigheter, Building E | N/A |
| CA Fastigheter, Building F | N/A |
| Åke Sundvall, Building B1 | Gold |
| Åke Sundvall, Building B2 | Gold |
| Åke Sundvall, Building B3 | Gold |
In Brofästet: HSB has been granted exemption from the daylight requirement with reference to the dense building structure.
Gasverket västra: The biggest challenges have been linked to the indicators daylight and thermal climate summer. In the buildings of cultural heritage value, the conditions to meet certain indicators have been limited, but the property developers have, within given frames, achieved the best possible result.
- CA Fastigheter, Building 7, Klätterverket: Thermal balance is important since it affects operations. Therefore great focus has been placed on achieving an optimal equivalent temperature year-round when designing the ventilation system.
- CA Fastigheter, Building 8, Berghs: The building houses classrooms, offices and a lecture auditorium. For the indicator daylight factor the BBR requirement cannot be met because new windows may not be opened up in the facade.
- CA Fastigheter, Building 20, Systembolaget. The building contains a shop with staff areas on the entrance floor and offices on the other floors.
- Real Estate Office, Hjorthagshallen. The building comprises three floors with sports hall, changing rooms, kitchen, serving and stands.
- Region Stockholm, Building 9, Spårvägsmuseet. The building consists of four floors. During the renovation great emphasis has been placed on the placement of work areas to maximise daylight intake. Existing windows have been supplemented with insulated glass to meet the energy requirements.
- SISAB, Bobergsskolan. The school's open learning environments have placed high demands on acoustics. The indoor climate has been simulated to ensure good comfort in both summer and winter.
- Vectura, Building 11, Förskolan Anna. The building has been rebuilt into a preschool on one floor. The layout is designed to promote openness between departments and rooms.
Jackproppen. For the Real Estate Office's building, the indicator thermal climate summer has been particularly challenging, mainly due to large window areas in clearly south-facing position.
Erik Wallin's project does not meet the requirement.
Starkströmmen: Trafikförvaltningen reaches Bronze level for the indoor environment and therefore does not meet the requirements.
Let nature do the job
Public land
Stormwater
In the phase Västra, a stormwater pond and a continuous wetland corridor have been built with capacity to handle large rainfall volumes. For Jackproppen and Starkströmmen, the volume of the planting beds has been calculated with a standard value of 0.5 metre depth. In coming phases, the air volume in the sunken rain beds is also included, as this functions as temporary detention volume during intense rain.
Generally, larger detention volumes have been built in earlier phases, while later phases work to a greater extent with integrated solutions in a denser urban structure.
Table 4.1 Stormwater detention, public land, per phase
| Norra 1 | Västra | Norra 2 | Brofästet | Jackproppen | Gasverket västra | Starkströmmen | Gasverket östra | Energihamnen | Södra Värtan norra | |
|---|---|---|---|---|---|---|---|---|---|---|
| Status | Moved in | Moved in | Moved in | Moved in | Moved in | Designed | Designed | Under implementation | Designed | Under implementation |
| Rain beds, m³ | – | – | – | 1,010 | 0 | 140 | 0 | 910 | 310 | 0 |
| Planting beds, m³ | 6,330 | 2,310 | 2,300 | 2,760 | 2,260 | 1,520 | 100 | 130 | 0 | 500 |
Green structure: Private land
Stormwater
Requirements – runoff coefficient
Residential blocks:
The weighted runoff coefficient may not exceed 0.25 for residential blocks and 0.4 for blocks with only premises.
Later phases:
Action level where the systems shall be dimensioned with a wet volume of 20 mm
Table 4.2 Runoff coefficient per property developer, phase
| Property developer | Runoff coefficient |
|---|---|
| Norra 2 | |
| Amasten | 0.38 |
| Bonava | 0.47 |
| Erik Wallin | 0.60 |
| HEBA | 0.26 |
| Skanska | 0.26 |
| Stockholmshem | 0.25 |
| Viktor Hanson | 0.47 |
| Wallenstam, housing | 0.47 |
| Wallenstam, preschool | N/A |
| Brofästet | |
| Besqab | 0.25 |
| HSB | 0.22 |
| Norrterna | 0.24 |
| Riksbyggen | 0.25 |
| Stockholmshem | N/A |
| Tobin Properties | 0.22 |
| Åke Sundvall | 0.25 |
| Einar Mattsson, Backåkra 2 | 0.22 |
| Einar Mattsson, Koppången 2 | N/A |
| Jackproppen (housing) | |
| Erik Wallin | 0.90 |
| Terrasskvarteren | |
| Selvaag | 0.28 |
| Obos | 0.25 |
| Jackproppen (premises) | |
| Real Estate Office, Park playground | N/A |
| Gasverket västra (new) | |
| SISAB, Bobergsskolan extension | 0.25 |
| Real Estate Office, Hjorthagshallen | N/A |
| Vectura, Förskolan Anna extension | N/A |
| Södra Värtan norra | |
| Bonnier Fastigheter, Portalen | 0.40 |
| Bonnier Fastigheter, Pirhuset | - |
| Niam, Hangö | 0.40 |
| Niam, Neapel | 0.37 |
| Starkströmmen | |
| Trafikverket | 0.80 |
| Elektriciteten | |
| Ellevio | 0.72 |
| Energihamnen | |
| Stockholm Exergi | - |
| Gasverket östra | |
| Åke Sundvall, Building B1 | 0.90 |
| Åke Sundvall, Building B2 | 0.90 |
| Åke Sundvall, Building B3 | 0.90 |
- In Norra 2, the requirement was only followed up in the as-built document.
- In Brofästet, follow-up has been carried out at early stages with consistently high quality in the documents. The reporting of Norrterna, Åke Sundvall and Einar Mattsson has not been approved.
- In Gasverket västra, the requirement did not apply to existing buildings.
- The Real Estate Office's park playground in Jackproppen has not submitted supporting documentation.
Table 4.3 Action level per property developer, phase
| Property developer | Action level, mm |
|---|---|
| Gasklocka 4 | |
| Obos | 20 |
| Ängsbotten | |
| Besqab | 20 |
| NREP | 20 |
| Primula | 20 |
| Wallenstam | 20 |
| Hjorthagskransen | |
| Djurgårdens Elitfotboll AB, Office | 5 |
| Södra Värtan norra | |
| Bonnier Fastigheter, Pirhuset | 20 |
| Bonnier Fastigheter, Portalen | - |
| Niam, Hangö | - |
| Niam, Neapel | - |
| Starkströmmen | |
| Trafikverket | - |
| Elektriciteten | |
| Ellevio | - |
| Energihamnen | |
| Stockholm Exergi | 20 |
| Gasverket östra | |
| Åke Sundvall, Building B1 | - |
| Åke Sundvall, Building B2 | - |
| Åke Sundvall, Building B3 | - |
| Terrasskvarteren | |
| Obos | 20 |
| Selvaag | - |
Green Space Index
Requirements – Green Space Index (GSI)
Residential blocks:
0.6
Blocks for premises:
0.4
- For later phases the requirement is calculated for each courtyard depending on the size of the courtyard and property. Balancing is determined.
- Existing buildings in Gasverket västra are not covered for cultural heritage reasons.
- A maintenance plan shall be drawn up to maintain the function of the green structure.
Norra 1 and Västra
Table 4.4 Green Space Index per courtyard, Norra 1 and Västra, housing
| Courtyard | Green Space Index |
|---|---|
| Norra 1 | |
| Abisko | 0.34 |
| Garphyttan | 0.60 |
| Gotska sandön | 0.31 |
| Skuleskogen | 0.38 |
| Västra | |
| Björnlandet | 0.39 |
| Färnebofjärden | 0.32 |
| Kosterhavet | 0.18 |
| Muddus | 0.58 |
| Norra Kvill, Padjelanda | 0.62 |
| Söderåsen | 0.18 |
| Tresticklan | 0.38 |
| Tyresta | 0.22 |
| Töfsingdalen | 0.31 |
Norra 1: 14% of the total roof area is made up of green roofs. NCC and Seniorgården share a courtyard that achieves a high Green Space Index because the courtyard is not built over and large soil depths could be created.
Västra: 44% of the total roof area is made up of green roofs. Nine of eleven property developers have sedum roofs. A large part of Primula's courtyard is not built over, which enables a more substantial soil depth. SKB's deep planting beds create good conditions for trees. Borätt and JM have built-over courtyards and thinner sedum roofs. The courtyard has shallow planting beds and consists mostly of lawn and shrubbery. ByggVesta has only a smaller green roof and shallow planting beds. Svenska Bostäder has a small courtyard and no green roof.
Table 4.5 Green Space Index per courtyard, Norra 2, Brofästet and Jackproppen, housing
| Courtyard | Green Space Index |
|---|---|
| Norra 2 | |
| Hornslandet | 0.62 |
| Sonfjället | 0.61 |
| Stora Sjöfallet | 0.60 |
| Brofästet | |
| Backåkra Courtyard 1 | 0.63 |
| Backåkra Courtyard 2 | 0.63 |
| Koppången Courtyard 1 | 0.61 |
| Koppången Courtyard 2 | 0.62 |
| Jackproppen (housing) | |
| Erik Wallin | 0.92 |
Norra 2: The share of green area of the total area is 38%. Norra 2 was the first phase with strict requirements for the Green Space Index. The high ambitions set early in the process have been lowered during the course of work. The roof structures have not always taken into account the weight of green roofs, which led to thinner sedum roofs being chosen in the end. All roofs, residential courtyards and several of the walls are utilised to meet the requirement. The courtyards are designed to be in and are perceived as greener than earlier phases.
Brofästet reaches a higher Green Space Index than the previous phase Norra 2, even though levels tend to decline during the project. It is clear that the understanding of the Green Space Index has increased, as has system thinking around stormwater management and integrated planting areas at early stages.
- Backåkra, courtyard 1 (Besqab, Norrterna, Åke Sundvall, Stockholmshem): A good example of coordination between property developers, landscape architect and water and sewage designer. Deep planting beds, integrated rain beds, edible shrubs, green facades and well-designed social areas provide both ecological and social values.
- Backåkra, courtyard 2 (Stockholmshem, Tobin Properties, Einar Mattsson): Large non-built-over areas and continuous green roofs with up to 800 mm soil depth. Almost half of the roofs consist of thick meadow roofs that benefit pollinators. Stormwater is handled in a combined roof and rain bed system.
- Jackproppen (Erik Wallin): As-built document is missing, which means final verification could not be carried out.
- Koppången, courtyard 1 (HSB, Riksbyggen): Biotope roof, roof terraces, large oak, pergolas and integrated stormwater management. Clear combination of ecological and social values.
- Koppången, courtyard 2 (Einar Mattsson): Combination of green roofs and solar PVs, green facades and fauna depots. Stormwater is led in several steps for improved purification and detention. High system understanding and well-considered level setting.
Table 4.6 Green Space Index, Jackproppen and Gasverket västra premises
| Courtyard/Property developer | Green Space Index |
|---|---|
| Jackproppen (premises) | |
| Park playground | 0.16 |
| Gasverket västra (new) | |
| Real Estate Office, Hjorthagshallen | 0.53 |
| SISAB, Bobergsskolan extension | 0.59 |
| Vectura, Förskolan Anna extension | 0.64 |
Jackproppen, Real Estate Office (the park playground): The low value is due to the sedum roof having insufficient soil depth and the property occupying the entire block, which limits the possibility of complementary green areas. The land also constitutes a blue corridor that handles cloudburst risk towards Västra, which further governs land use.
Gasverket västra
- At the sports hall, the school and the preschool, the surfaces are subjected to harder wear and other use than ordinary residential courtyards, which limits the possibilities of accommodating all desired functions. The need for hardened surfaces means that vegetation is mainly placed in edge zones and on roofs and walls.
- Real Estate Office (Hjorthagshallen) does not reach the GSI requirement because proposed improvement measures have not been implemented, such as taller planting beds on the sedum roofs and measures to strengthen biotopes. The request for deviation was rejected. The building has climbing plants on the facade, trees in skeleton soil that handle stormwater, and a sedum roof.
- SISAB (Bobergsskolan) was approved with GSI 0.59 after adjusted conditions. The small schoolyard requires large hardened surfaces, but deep planting beds and several oaks have been planted.
- Vectura (Building 11, Förskolan Anna) meets the requirement in the system document. As-built document is missing. The preschool has a sedum roof, fruit trees, flowering trees and shrubs, and climbing plants against the fence.
Table 4.7 Green Space Index, designed housing and premises
| Courtyard/Property developer | Green Space Index |
|---|---|
| Gasklocka 4 | |
| Obos | 1.11 |
| Terrasskvarteren | |
| Obos | 0.61 |
| Selvaag | 0.79 |
| Ängsbotten | |
| Besqab | 0.67 |
| NREP | 0.60 |
| Primula | 0.60 |
| Wallenstam | 0.67 |
| Södra Värtan norra | |
| Bonnier Fastigheter, Pirhuset | 0.51 |
| Bonnier Fastigheter, Portalen | 0.53 |
| Niam, Hangö | 0.53 |
| Niam, Neapel | 0.69 |
| Starkströmmen | |
| Trafikverket | 0.60 |
| Elektriciteten | |
| Ellevio | 0.45 |
| Energihamnen | |
| Stockholm Exergi | 0.20 |
| Gasverket östra | |
| CA Fastigheter, Building 19 | 0.39 |
| CA Fastigheter, Building D | 0.53 |
| CA Fastigheter, Building E | 0.30 |
| CA Fastigheter, Building F | 0.31 |
| Åke Sundvall, Building B1 | 0.98 |
| Åke Sundvall, Building B2 | 0.98 |
| Åke Sundvall, Building B3 | 0.98 |
Elektriciteten: In the project, points are credited for two large trees, one of which is an oak, as well as about 1,010 m² of green land, of which 755 m² is meadowland. Three new trees are being planted, including one character tree, and parts of the stormwater are led to planting beds. In implementation the ambition has been lowered. This means that the balancing for cultural ecosystem services cannot be approved.
Södra Värtan norra. The ambition is to use the roofs to a greater extent than in earlier phases, for example through more biotope roofs and roof terraces with social areas.
- Neapel, Niam: The project shows well-utilised roof areas with both social and ecological values. Meadow vegetation, shrubs and smaller multi-stemmed trees with generous soil depths are planned. A large proportion of the plant material consists of natural species selection. The design includes pergolas, fauna depots and green walls. At street level a rain garden is being built and oaks are being planted.
- Hangö, Bonnier and Niam: An interesting and feasible proposal based on roof terraces on different levels, with locally raised vegetation areas containing shrubs and smaller trees. The project has worked with a broad natural species selection and high diversity in the field layer. On the roof terraces, open water surfaces are integrated as well as biological design elements such as dead wood, bumblebee nests, insect hotels and various types of bird boxes. Meets the requirement in the construction document with GSI 0.53.
- Block BC / Pirhuset / Bonnier, programme document: Meets GSI requirements and balancing. For the next stage, clarifications are requested regarding the extent of facade greenery, species selection linked to character habitats, and the design and content of the butterfly border.
Terrasskvarteren
- Selvaag Pluss, system document. The courtyard is designed with varied and species-rich vegetation that frames private outdoor seating areas and shared activity areas. The plantings offer flowering across the seasons, edible berries and nectar and pollen sources for pollinating insects. The residential courtyard contains several community areas as well as a greenhouse for cultivation and socialising. Rain beds are built in connection with downpipes to purify and detain stormwater from roof surfaces. Stormwater from the orangery's roof is also recovered in rain barrels and can be reused by residents for irrigation of plantings and growing boxes. The courtyard has large social areas. The forecourt area is designed with verdant plantings that enrich the street space while at the same time providing space for bicycle parking for residents and visitors.
- OBOS, system document. Green forecourt area is planned and contributes to a more lively and ecologically active street space. Perennials benefit pollinating insects. All trees and several shrubs produce berries and fruit that are edible. Vertical greenery is integrated. The courtyard houses common outdoor seating areas and a greenhouse for cultivation and social interaction. Stormwater from roofs and terraces is led to underground reservoirs for detention. Roof water from the greenhouse is collected in rain harvesting barrels for reuse for irrigation of plantings.
Gasklocka 4 / Stadsljus, system document: A well-worked proposal that both makes use of existing values and adds new ones. In some sections it appears challenging to achieve at least 800 mm soil depth and sufficient soil volume for trees. The reporting of diversity in field layer, species selection from character habitats, and habitat-strengthening environments needs to be supplemented in the next stage. The maintenance plan is clear and well-worked.
Ängsbotten
- Primula, programme document. The buildings are provided with green roofs with 120-300 mm planting bed. The courtyard contains bearing shrubs and fruit trees as well as plantings with species selection from the character habitat oak and noble deciduous forest. There are also flower displays and butterfly borders. Stormwater management is consistently well integrated, for example through permeable ground materials, drainage from hardened surfaces to planting beds, water mirrors and collection of rainwater for irrigation. Social areas are well planned.
- Wallenstam, programme document. The courtyard is designed as a coherent, undulating glade with a central lawn, framed by an edge zone with multi-layered greenery consisting of multi-stemmed trees, solitary shrubs and plantings with grasses and perennials. Coarse branches and smaller stone blocks are integrated as habitats for insects and reinforce the feel of a forest edge. The block square is framed by plantings along the gables of the buildings.
- NREP, programme document. The courtyard's shadier locations are suitable for small-children's play and quiet stays. Roof terraces complement the courtyard with sunlit green outdoor seating areas for cultivation and meetings. Stormwater management is integrated in the design through larger green areas, tree plantings and open solutions.
Energihamnen Stockholm Exergi, system document. The design is governed by extensive port, fire and safety requirements, which means that trees and taller vegetation cannot be planted. Parts of the roof water are infiltrated in rain beds between the new building and Norra hamnvägen. The water is led via balancing boxes to planting beds with rain bed substrate and draining macadam. At heavy flows water is allowed to stand at the surface and overflow via wells in the forecourt area.
Hjorthagen 11, Trafikverket operations depot, system document. The proposal contains a sedum roof on the main building as well as a larger canopy with biotope roof. Towards the adjacent street, a combined planting with trees, shrubs and perennials including a rain bed is proposed. A large existing oak is preserved. The investment in green roofs means that more than 40% of the block is made up of vegetated area. The maintenance plan is approved and well-worked.
Table 4.8 Share of green structure, private land, phase, %
| Phase | Share of green area* of total area, % | Share of green roofs of total roof area, % |
|---|---|---|
| Norra 1 | 37 | 14 |
| Västra | 37 | 44 |
| Norra 2 | 40 | 44 |
| Brofästet | 35 | 37 |
| Värtapiren | 2 | 49 |
| Jackproppen | 69 | 86 |
| Gasverket västra | 10 | 28 |
Green area refers to green oasis, green roofs and courtyards.
Consultation and learning
Table 5.1 Communication and skills development
| 2025 | 2024 | 2023 | 2022 | 2021 | 2020 | 2019 | 2018 | 2017 | 2016-2010 | |
|---|---|---|---|---|---|---|---|---|---|---|
| Study visitors | 4,930 | 5,600 | 5,700 | 4,250 | 1,900 | 2,000 | 6,000 | 7,000 | 5,400 | 21,500 |
| Skills development | 250 | 170 | 550 | 640 | 430 | 265 | 110 | 140 | 350 | 915 |
| Introduction of professionals | 2,150 | 1,580 | 1,400 | 1,000 | 840 | 2,820 | 760 | 5,420 | 3,450 | |
| Other activities | 7,000 | 7,000 | 6,000 | 5,000 | 620 | 360 | 8,500 | 2,300 |
Table 5.2 Employment of people far from the labour market
| Description | Number of people | Type of employment |
|---|---|---|
| 2025 | ||
| The contractor in the soil remediation at Kolkajen, PEAB, had one LIA trainee in spring 2025 from Nackademin. | 1 | LIA placement |
| Skanska (Saltkajen and Saltpiren) had one LIA trainee during spring 2025. | 1 | LIA placement |
| In3prenör and their subcontractor in GK2 have employed three people during 2025. One ended due to high absence. | 3 | Employed by In3prenör or their subcontractor |
| 2024 | ||
| Skanska (Saltkajen and Saltpiren) took in three people during 2024. One apprentice has been employed. | 3 | Apprentices, one of whom was employed |
| In3prenör in GK2 has had one person during 2024. | 1 | subcontractor to In3prenör, trainee |